Today, we present the culmination of 2.5 years of intensive research, which has led to the development of an advanced statistical methodology for the precise identification of price levels (Supply and Demand). This study is founded upon a core premise: Price movement is not random, but rather a logical and measurable response to predefined areas that represent points of market equilibrium and oscillation.
We relied on a Rigorous Quantitative Historical Analysis of each individual price level (Support or Resistance), processing a matrix of Statistical Variables to deduce the Probability of the price's interaction with these levels.
🧮 Axes of Systematic Statistical Analysis:
The research focused on answering the following critical questions for every major level:
1- Breakout Event: Has the resistance or support level been confirmed as breached?
----*In Case of Breakout (Yes):
--------*Time-to-Revisit ($T_R$): What is the time period ($t$) taken for the price to return to
the breached level after moving away?
--------*Post-Breakout Momentum ($M_{PB}$): What is the percentage change in price after the
breakout and confirmed movement away?
----*In Case of Reversal (No):
--------*Time-to-Revisit ($T_R$): What is the time period ($t$) taken for the price to return to
the level after reversing from it?
--------*Reversal Magnitude ($R_{Mag}$): What is the percentage magnitude of the reversal
achieved after touching the level?
This data was processed using Mathematical Models and Inferential Statistics, allowing us to construct a Price Map that is nearly a reflection of the Empirical Truth of market movement.
📈 The Call for Observation and the Proposed Trading Methodology:
🎯 Your Task:
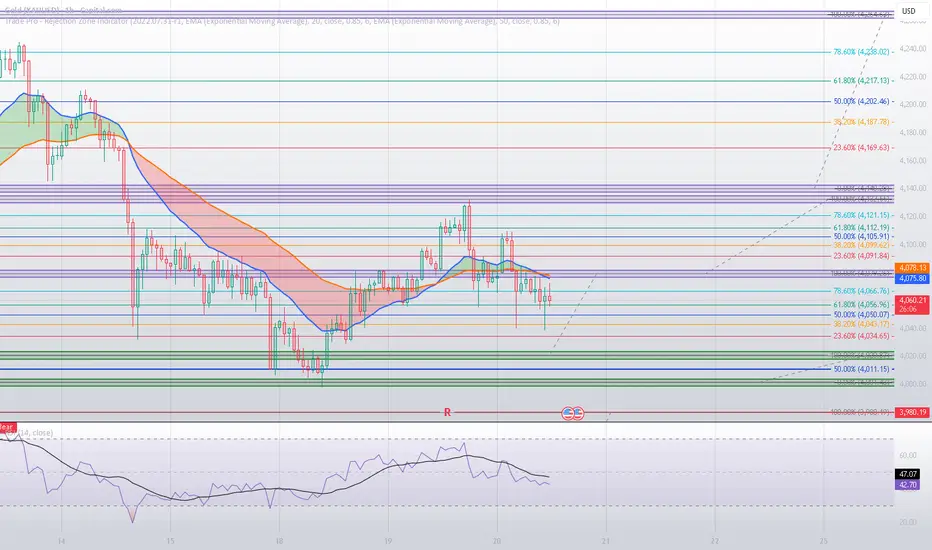
We invite you to engage in Systematic and Objective Observation only. Monitor the future performance of the price and its Interaction and Response to the levels shown on the attached chart. We ask only that you witness the power of this statistical model.
📐 Geometric Sequence Integration (Fibonacci):
To enhance the Trading Appeal and provide an additional framework, Fibonacci Retracement levels have been integrated between every major price level.
📘 Systematic Decision Rule (Algorithmic Trading Rule):
Adopt a simple yet effective rule to filter your trades:
----*Bearish Indicator: If the price is below the 50% Fibonacci level (the geometric center
between the two levels), look for Short Positions, targeting the next lower level.
----*Bullish Indicator: If the price has broken the 50% Fibonacci level, look for Long Positions,
targeting the next higher level.
⚠️ Crucial Validation:
The Breakout Confirmation must be validated by a full Price Candle Close above or below the level. An instantaneous price spike is not considered a valid signal for applying the rule.
-----------------------------------------------------------------------------------------------
This methodology represents a qualitative leap in market analysis, transforming Supports and Resistances from mere lines into High-Probability Decision Zones backed by mathematical logic.
YOU CAN CLICK TO SEE CHART : tradingview.com/chart/4LsOIXF4/
We relied on a Rigorous Quantitative Historical Analysis of each individual price level (Support or Resistance), processing a matrix of Statistical Variables to deduce the Probability of the price's interaction with these levels.
🧮 Axes of Systematic Statistical Analysis:
The research focused on answering the following critical questions for every major level:
1- Breakout Event: Has the resistance or support level been confirmed as breached?
----*In Case of Breakout (Yes):
--------*Time-to-Revisit ($T_R$): What is the time period ($t$) taken for the price to return to
the breached level after moving away?
--------*Post-Breakout Momentum ($M_{PB}$): What is the percentage change in price after the
breakout and confirmed movement away?
----*In Case of Reversal (No):
--------*Time-to-Revisit ($T_R$): What is the time period ($t$) taken for the price to return to
the level after reversing from it?
--------*Reversal Magnitude ($R_{Mag}$): What is the percentage magnitude of the reversal
achieved after touching the level?
This data was processed using Mathematical Models and Inferential Statistics, allowing us to construct a Price Map that is nearly a reflection of the Empirical Truth of market movement.
📈 The Call for Observation and the Proposed Trading Methodology:
🎯 Your Task:
We invite you to engage in Systematic and Objective Observation only. Monitor the future performance of the price and its Interaction and Response to the levels shown on the attached chart. We ask only that you witness the power of this statistical model.
📐 Geometric Sequence Integration (Fibonacci):
To enhance the Trading Appeal and provide an additional framework, Fibonacci Retracement levels have been integrated between every major price level.
📘 Systematic Decision Rule (Algorithmic Trading Rule):
Adopt a simple yet effective rule to filter your trades:
----*Bearish Indicator: If the price is below the 50% Fibonacci level (the geometric center
between the two levels), look for Short Positions, targeting the next lower level.
----*Bullish Indicator: If the price has broken the 50% Fibonacci level, look for Long Positions,
targeting the next higher level.
⚠️ Crucial Validation:
The Breakout Confirmation must be validated by a full Price Candle Close above or below the level. An instantaneous price spike is not considered a valid signal for applying the rule.
-----------------------------------------------------------------------------------------------
This methodology represents a qualitative leap in market analysis, transforming Supports and Resistances from mere lines into High-Probability Decision Zones backed by mathematical logic.
YOU CAN CLICK TO SEE CHART : tradingview.com/chart/4LsOIXF4/
Отказ от ответственности
Информация и публикации не предназначены для предоставления и не являются финансовыми, инвестиционными, торговыми или другими видами советов или рекомендаций, предоставленных или одобренных TradingView. Подробнее читайте в Условиях использования.
Отказ от ответственности
Информация и публикации не предназначены для предоставления и не являются финансовыми, инвестиционными, торговыми или другими видами советов или рекомендаций, предоставленных или одобренных TradingView. Подробнее читайте в Условиях использования.