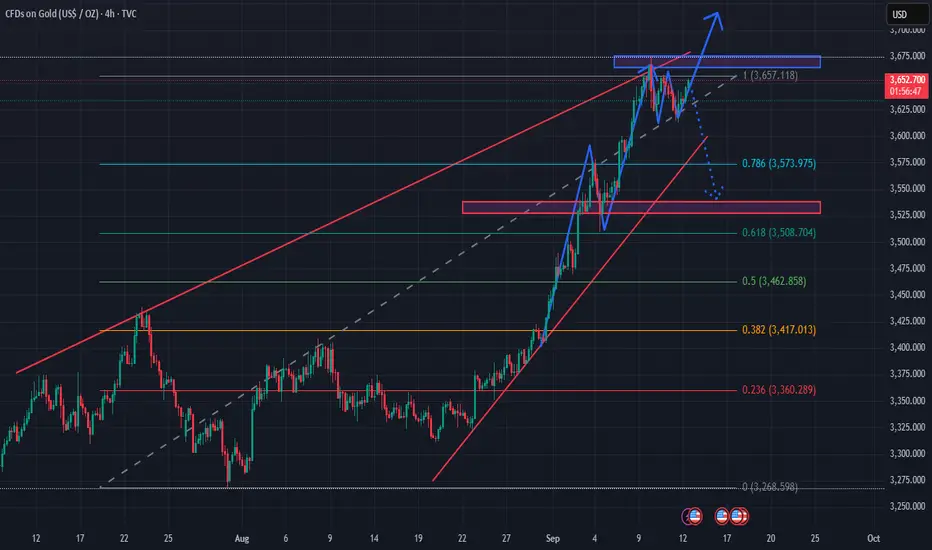
1. Main Trend
Gold remains in a strong uptrend, forming higher highs and higher lows.
The rising channel (red trendlines) is still intact, though price is now testing a strong resistance zone.
2. Resistance Zone & Upside Target
Key resistance area: 3,650 – 3,670 USD/oz (blue box on the chart).
If price breaks clearly above 3,670, the next target will likely be 3,700 – 3,720 (psychological level and Fibonacci extension zone).
3. Pullback Scenario
If price fails to break resistance, a pullback may occur toward Fibonacci retracement levels:
Fib 0.786 ≈ 3,574 USD (nearest support).
Fib 0.618 ≈ 3,509 USD (major support, aligning with previous demand zone – red box).
Fib 0.5 ≈ 3,463 USD (intermediate support).
The 3,500 – 3,510 USD zone is a critical support area; if broken, a deeper correction could unfold.
4. Technical Signals
Price is forming a small triangle/pennant pattern right at resistance → suggesting a strong breakout is likely soon.
RSI/Momentum (not shown here but typically at these levels) may be in overbought territory, increasing the chance of a short-term correction before resuming higher.
5. Trading Scenarios
Bullish case (preferred): Buy if price breaks above 3,670 with confirmation, target around 3,700 – 3,720.
Bearish case: If price gets rejected at resistance and breaks below the rising trendline, short-term selling may target 3,574 – 3,510.
📌 Summary:
The main trend remains bullish, but the 3,650 – 3,670 zone is the decision point.
A confirmed breakout → 3,700+.
Failure to hold → correction toward 3,574 or deeper to 3,510.
✅MY FREE FOREX & XAUUSD SIGNALS TELEGRAM CHANNEL:
t.me/Jenny_in_your_area
🔴9-12 signals per day
🔴Free knowledge support
🔴24/7 support for newbies.
🔴You always have priority.
JENDA FISH 😘
t.me/Jenny_in_your_area
🔴9-12 signals per day
🔴Free knowledge support
🔴24/7 support for newbies.
🔴You always have priority.
JENDA FISH 😘
Похожие публикации
Отказ от ответственности
Все виды контента, которые вы можете увидеть на TradingView, не являются финансовыми, инвестиционными, торговыми или любыми другими рекомендациями. Мы не предоставляем советы по покупке и продаже активов. Подробнее — в Условиях использования TradingView.