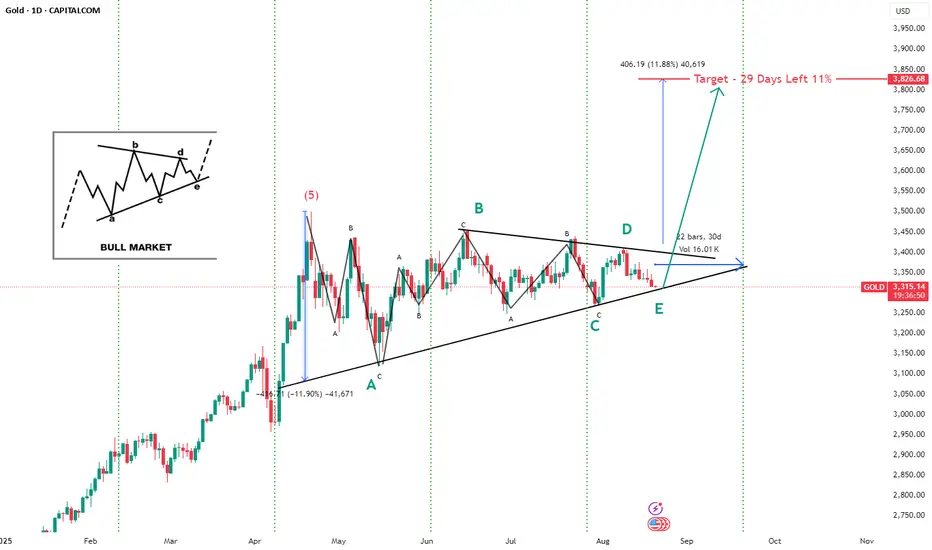
Pattern: The chart shows a Bullish Symmetrical Triangle (ABCDE structure) after a 5-wave rally.
Wave Count: Labeled as A–B–C–D–E consolidation within converging trendlines.
Current Position: Price is near point E, suggesting the triangle is close to completion.
Projection: A bullish breakout is expected after wave E.
Target:
Price: ~3,826.68 USD
Gain: +406.19 points (+11.88%)
Timeframe: ~29 days remaining (projection into September).
Volume: Moderate (~15.74K) during consolidation.
Technical Context:
Left inset shows a Bull Market triangle breakout schematic, indicating this setup aligns with a bullish continuation pattern.
The April correction (-11.9%) reset the trend, followed by the ongoing consolidation.
📌 Conclusion: Gold is forming a bullish continuation triangle and may rally ~11% toward 3,826 if the breakout occurs within the projected timeframe (about a month).
Technical Analyst BY Passion
Отказ от ответственности
Все виды контента, которые вы можете увидеть на TradingView, не являются финансовыми, инвестиционными, торговыми или любыми другими рекомендациями. Мы не предоставляем советы по покупке и продаже активов. Подробнее — в Условиях использования TradingView.