GAP resistance again
Blue line from the highest high and down trending
[the recent high breaking this trend all QE ? ]
channels are resistance zones from gaps and hi/low peaks [ R&S}
[ hate i can not see chart while making comments ! ]
seeing if secondary resistance lines are S&R - noticing gaps in these channels occasionally
Заметка
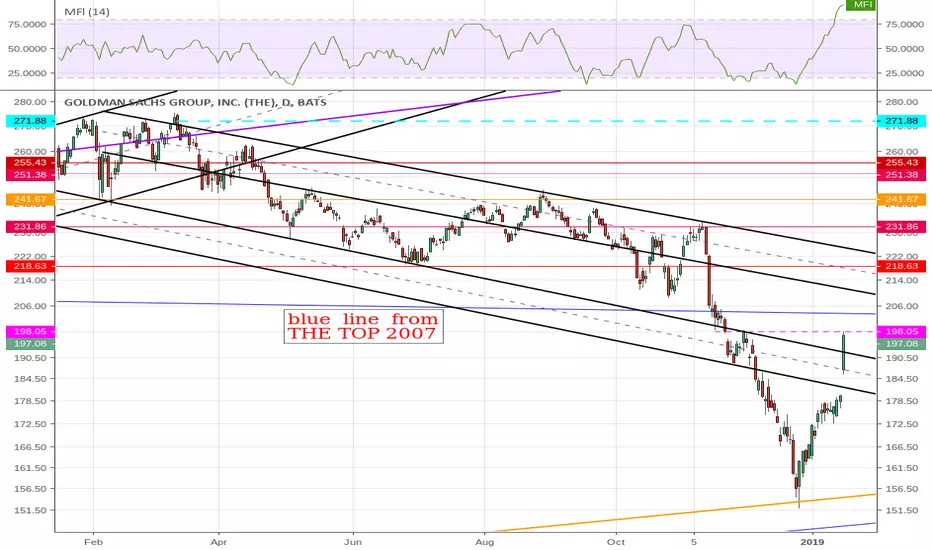
the blue line which is the top from 10/15/2007 and
down-trending from 6/1/2015
below 5/2017 bottom
seems to be a resistance here
waiting to see what happens when we get to down trend black channel
Отказ от ответственности
Информация и публикации не предназначены для предоставления и не являются финансовыми, инвестиционными, торговыми или другими видами советов или рекомендаций, предоставленных или одобренных TradingView. Подробнее читайте в Условиях использования.
Отказ от ответственности
Информация и публикации не предназначены для предоставления и не являются финансовыми, инвестиционными, торговыми или другими видами советов или рекомендаций, предоставленных или одобренных TradingView. Подробнее читайте в Условиях использования.