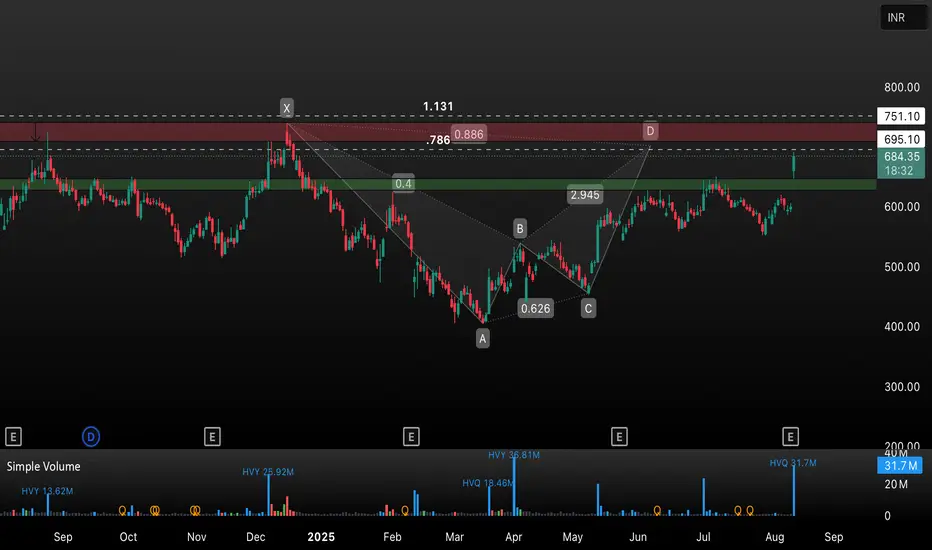
HB LENG has demonstrated a strong bullish breakout, surging over 13% and breaking past previous resistance. The chart displays a completed harmonic pattern with the price moving towards the D point zone (751 level). Key resistance lies between 695 – 751, with Fibonacci levels (.786/.886) as potential reversal zones.
Trade Insight:
• Support: 620–695 (green zone)
• Resistance: 695–751 (red zone)
• Watch for price action near the 751 zone; a breakout could trigger a fresh uptrend, while rejection may see consolidation or pullback.
• High volume confirms strong buyer interest.
Strategy:
Consider booking partial profits as price approaches resistance. Wait for confirmation before entering new positions. Ideal for swing traders watching for breakout or reversal signs.
Отказ от ответственности
Все виды контента, которые вы можете увидеть на TradingView, не являются финансовыми, инвестиционными, торговыми или любыми другими рекомендациями. Мы не предоставляем советы по покупке и продаже активов. Подробнее — в Условиях использования TradingView.
Отказ от ответственности
Все виды контента, которые вы можете увидеть на TradingView, не являются финансовыми, инвестиционными, торговыми или любыми другими рекомендациями. Мы не предоставляем советы по покупке и продаже активов. Подробнее — в Условиях использования TradingView.