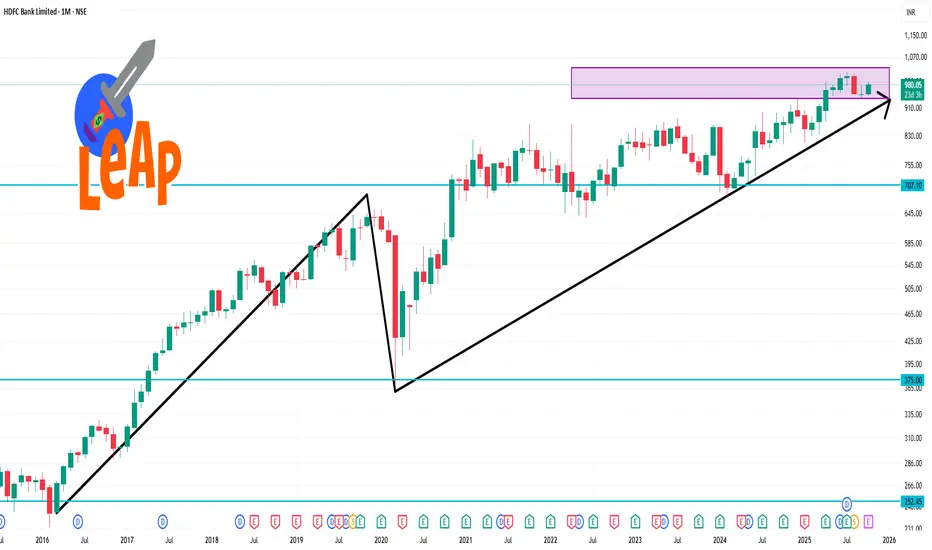
📊 1-Month Technical Outlook
Technical Rating: Strong Buy
Pivot Points:
Classic: Pivot: ₹960.28 | Support: ₹937.03, ₹951.12 | Resistance: ₹974.37, ₹983.53, ₹997.62
Fibonacci: Pivot: ₹960.28 | Support: ₹945.91, ₹951.40 | Resistance: ₹974.65, ₹983.53
Camarilla: Pivot: ₹961.30 | Support: ₹961.09, ₹963.80 | Resistance: ₹967.85, ₹969.21
Moving Averages:
Short-Term (MA5, MA10, MA20): Buy
Medium-Term (MA50): Sell
Long-Term (MA100, MA200): Buy
Relative Strength Index (RSI): 50.54 (Neutral)
MACD: -4.82 (Sell)
Average True Range (ATR): 13.27 (Moderate Volatility)
ADX (Trend Strength): 19.12 (Weak Trend)
Williams %R: -36.70 (Buy)
Commodity Channel Index (CCI): -13.66 (Neutral)
Rate of Change (ROC): -0.22 (Sell)
🔍 Summary
HDFC Bank's stock shows a bullish trend over the past month, with positive technical indicators and a strong buy signal. However, the neutral RSI and sell signal from the MACD suggest caution. Investors should monitor these indicators closely for potential shifts in market sentiment.
Похожие публикации
Отказ от ответственности
Все виды контента, которые вы можете увидеть на TradingView, не являются финансовыми, инвестиционными, торговыми или любыми другими рекомендациями. Мы не предоставляем советы по покупке и продаже активов. Подробнее — в Условиях использования TradingView.
Похожие публикации
Отказ от ответственности
Все виды контента, которые вы можете увидеть на TradingView, не являются финансовыми, инвестиционными, торговыми или любыми другими рекомендациями. Мы не предоставляем советы по покупке и продаже активов. Подробнее — в Условиях использования TradingView.