📊 1-Hour Timeframe: Key Levels
🔹 Support Levels
Immediate Support: ₹1,363.14
Key Support Zones: ₹1,352.93, ₹1,333.87
🔹 Resistance Levels
Immediate Resistance: ₹1,367.07
Key Resistance Zones: ₹1,385.23, ₹1,398.47
These levels are derived from standard pivot point calculations and are commonly used by traders to identify potential reversal points within the trading day.
📈 Technical Indicators (1-Hour Chart)
Relative Strength Index (RSI): 37.26 — indicates the stock is nearing oversold conditions, suggesting potential for a price rebound.
Moving Average Convergence Divergence (MACD): -16.11 — a negative value, which may indicate bearish momentum.
Average Directional Index (ADX): 23.81 — suggests a weak trend, implying indecision in the market.
Stochastic Oscillator: 13.21 — indicates the stock is oversold, potentially signaling a reversal.
Supertrend Indicator: ₹1,398.34 — indicates a bearish trend.
These indicators collectively suggest a bearish short-term outlook, with potential for a reversal if support levels hold.
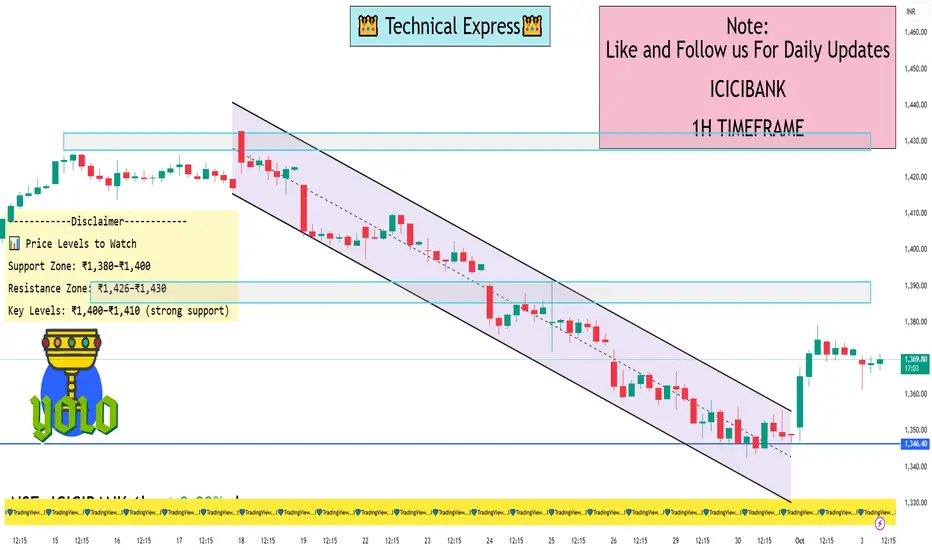
📊 Price Levels to Watch
Support Zone: ₹1,380–₹1,400
Resistance Zone: ₹1,426–₹1,430
Key Levels: ₹1,400–₹1,410 (strong support)
🔄 Summary
ICICI Bank Ltd. is currently trading near its support levels on the 1-hour chart. The RSI indicates potential oversold conditions, while other indicators suggest a weak bearish trend. Traders should monitor the key support and resistance levels mentioned above for potential breakout or breakdown scenarios.
🔹 Support Levels
Immediate Support: ₹1,363.14
Key Support Zones: ₹1,352.93, ₹1,333.87
🔹 Resistance Levels
Immediate Resistance: ₹1,367.07
Key Resistance Zones: ₹1,385.23, ₹1,398.47
These levels are derived from standard pivot point calculations and are commonly used by traders to identify potential reversal points within the trading day.
📈 Technical Indicators (1-Hour Chart)
Relative Strength Index (RSI): 37.26 — indicates the stock is nearing oversold conditions, suggesting potential for a price rebound.
Moving Average Convergence Divergence (MACD): -16.11 — a negative value, which may indicate bearish momentum.
Average Directional Index (ADX): 23.81 — suggests a weak trend, implying indecision in the market.
Stochastic Oscillator: 13.21 — indicates the stock is oversold, potentially signaling a reversal.
Supertrend Indicator: ₹1,398.34 — indicates a bearish trend.
These indicators collectively suggest a bearish short-term outlook, with potential for a reversal if support levels hold.
📊 Price Levels to Watch
Support Zone: ₹1,380–₹1,400
Resistance Zone: ₹1,426–₹1,430
Key Levels: ₹1,400–₹1,410 (strong support)
🔄 Summary
ICICI Bank Ltd. is currently trading near its support levels on the 1-hour chart. The RSI indicates potential oversold conditions, while other indicators suggest a weak bearish trend. Traders should monitor the key support and resistance levels mentioned above for potential breakout or breakdown scenarios.
I built a Buy & Sell Signal Indicator with 85% accuracy.
📈 Get access via DM or
WhatsApp: wa.link/d997q0
Contact - +91 76782 40962
| Email: techncialexpress@gmail.com
| Script Coder | Trader | Investor | From India
📈 Get access via DM or
WhatsApp: wa.link/d997q0
Contact - +91 76782 40962
| Email: techncialexpress@gmail.com
| Script Coder | Trader | Investor | From India
Похожие публикации
Отказ от ответственности
Информация и публикации не предназначены для предоставления и не являются финансовыми, инвестиционными, торговыми или другими видами советов или рекомендаций, предоставленных или одобренных TradingView. Подробнее читайте в Условиях использования.