On the Weekly chart I see excellent price divergence to the MACD indicator

On the daily chart there is also an excellent price divergence towards the indicator.

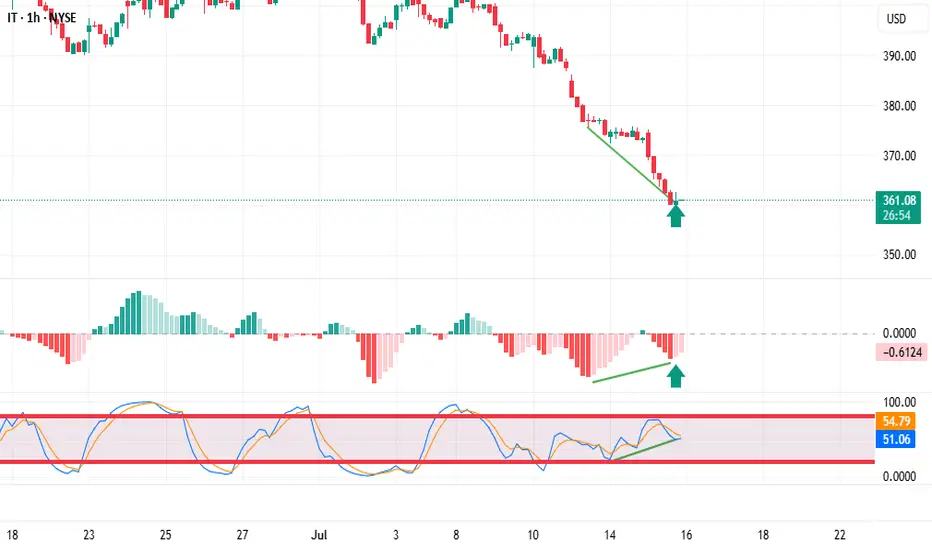
The hourly chart confirms the analysis; there is also a price divergence to the indicator.

The signal for me to enter a trade is that the histogram has stopped decreasing and changed the color of the bar from red to light pink
I placed a pending order above the bar marked with an arrow, and a stop loss below it.
 IT
IT
On the daily chart there is also an excellent price divergence towards the indicator.
The hourly chart confirms the analysis; there is also a price divergence to the indicator.
The signal for me to enter a trade is that the histogram has stopped decreasing and changed the color of the bar from red to light pink
I placed a pending order above the bar marked with an arrow, and a stop loss below it.
Заметка
The price did not activate my buy order above the previous candle. Moved a buy order above the current barСделка активна
Отказ от ответственности
Информация и публикации не предназначены для предоставления и не являются финансовыми, инвестиционными, торговыми или другими видами советов или рекомендаций, предоставленных или одобренных TradingView. Подробнее читайте в Условиях использования.
Отказ от ответственности
Информация и публикации не предназначены для предоставления и не являются финансовыми, инвестиционными, торговыми или другими видами советов или рекомендаций, предоставленных или одобренных TradingView. Подробнее читайте в Условиях использования.