Fibonacci retracement is one of the simplest yet most consistent tools for studying how markets correct within trends.
To understand it better, here’s a clean example from J.K. Cement.
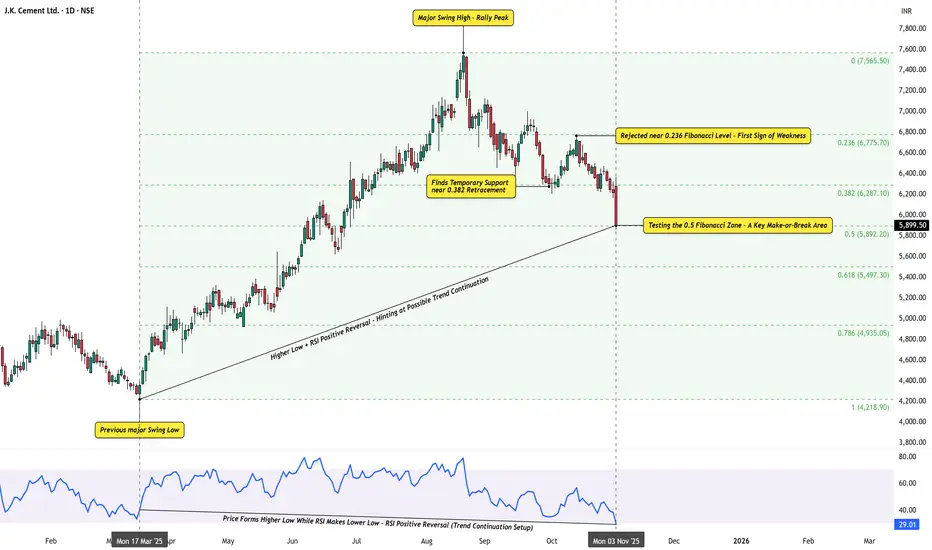
After a strong uptrend from the March 2025 swing low to ₹7,565, the stock began to retrace. Notice how price behavior respected the Fibonacci structure:
Even the RSI pattern offers insight — price forms a higher low while RSI makes a lower low, a textbook positive reversal setup that often aligns with trend studies.
The purpose of this example isn’t prediction, but to show how Fibonacci ratios and RSI behavior interact — highlighting rhythm, structure, and market psychology in motion.
Disclaimer: This analysis is for educational purposes only and does not constitute investment advice. Please do your own research (DYOR) before making any trading decisions.
To understand it better, here’s a clean example from J.K. Cement.
After a strong uptrend from the March 2025 swing low to ₹7,565, the stock began to retrace. Notice how price behavior respected the Fibonacci structure:
- It bounced from the 0.382 level, illustrating a temporary reaction point.
- Later, it faced resistance near 0.236, where rallies often stall during corrective phases.
- The 0.5 retracement zone now serves as a classic testing ground that often helps define trend continuation or deeper correction.
Even the RSI pattern offers insight — price forms a higher low while RSI makes a lower low, a textbook positive reversal setup that often aligns with trend studies.
The purpose of this example isn’t prediction, but to show how Fibonacci ratios and RSI behavior interact — highlighting rhythm, structure, and market psychology in motion.
Disclaimer: This analysis is for educational purposes only and does not constitute investment advice. Please do your own research (DYOR) before making any trading decisions.
WaveXplorer | Elliott Wave insights
📊 X profile: @veerappa89
📊 X profile: @veerappa89
Отказ от ответственности
Информация и публикации не предназначены для предоставления и не являются финансовыми, инвестиционными, торговыми или другими видами советов или рекомендаций, предоставленных или одобренных TradingView. Подробнее читайте в Условиях использования.