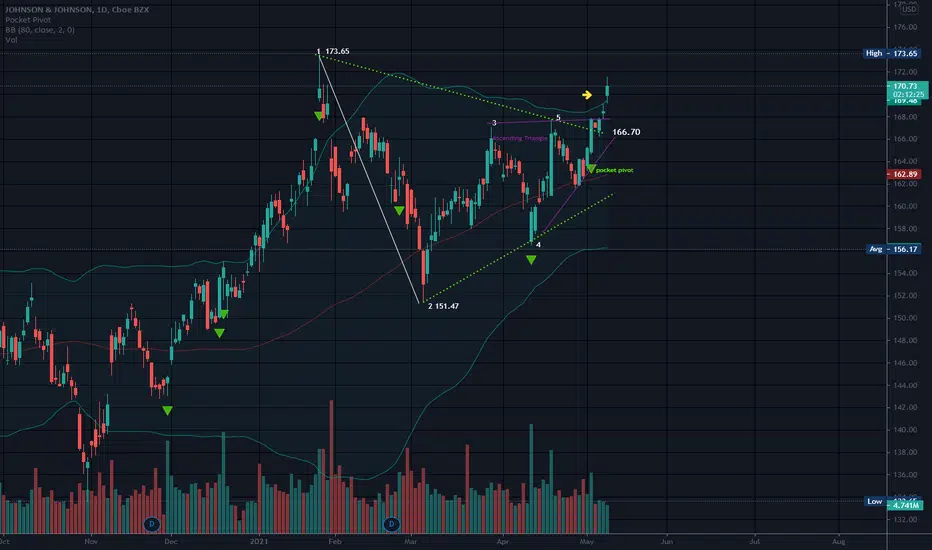
173.65 is the long term high.
JNJ has broken free of both triangles, as well as the bollinger bands.
Bollinger bands are set on this chart using an eighty day moving average verses the norm of 20. Price is above the top band today which is bullish, but it is likely that price will return to the inside of the bands.
No recommendation
Отказ от ответственности
Все виды контента, которые вы можете увидеть на TradingView, не являются финансовыми, инвестиционными, торговыми или любыми другими рекомендациями. Мы не предоставляем советы по покупке и продаже активов. Подробнее — в Условиях использования TradingView.
Отказ от ответственности
Все виды контента, которые вы можете увидеть на TradingView, не являются финансовыми, инвестиционными, торговыми или любыми другими рекомендациями. Мы не предоставляем советы по покупке и продаже активов. Подробнее — в Условиях использования TradingView.