Description:
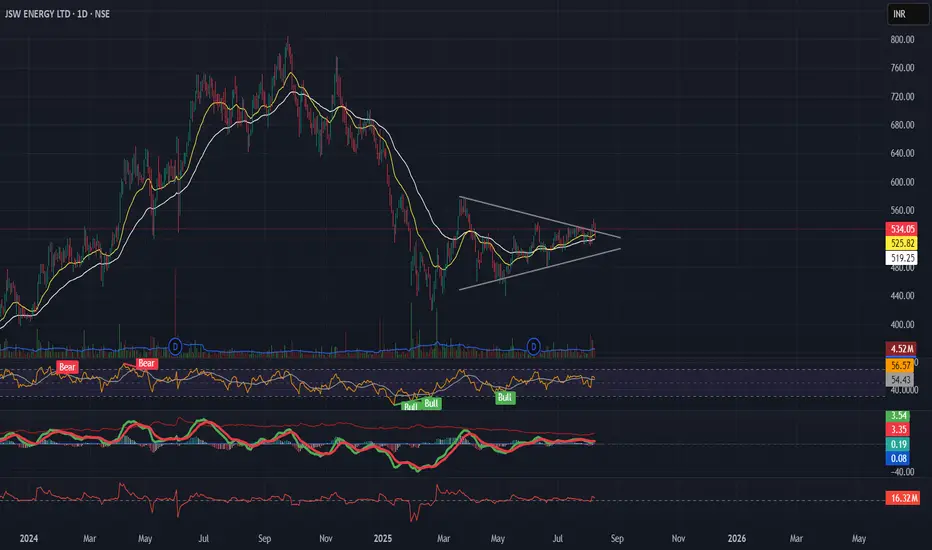
JSW Energy is forming a symmetrical triangle on the daily chart after a downtrend — resembling a potential bearish pennant, but price structure, sloping EMAs, rising momentum, and positive EFI hint at bullish strength.
📌 Breakout Level: ₹534
📉 Stoploss: ₹519 (ATR-based)
🎯 Targets: ₹563 → ₹597 → ₹694 (as per Fib projections)
🧭 Macro Context:
- Infra & Energy sectors improving
- Govt push for renewables
- Dollar weakening, risk-on tone aiding sentiment
Structure, volume, and macro are aligned — tracking this breakout closely.
Отказ от ответственности
Все виды контента, которые вы можете увидеть на TradingView, не являются финансовыми, инвестиционными, торговыми или любыми другими рекомендациями. Мы не предоставляем советы по покупке и продаже активов. Подробнее — в Условиях использования TradingView.
Отказ от ответственности
Все виды контента, которые вы можете увидеть на TradingView, не являются финансовыми, инвестиционными, торговыми или любыми другими рекомендациями. Мы не предоставляем советы по покупке и продаже активов. Подробнее — в Условиях использования TradingView.