🔍 Fundamentals (from Screener & other sources)
Market Cap: ~ ₹69,000 Cr.
Revenue / Profit: Last reported revenue ~₹4,690 Cr, Profit ~₹1,614 Cr.
5-Yr Profit Growth: ~51.5% CAGR.
Valuation:
P/E is very high (in some sources ~186×) which suggests heavy premium pricing.
P/B ≈ 13.3×.
Returns: ROE ~14.5%, ROCE ~13.3%.
Dividend Yield: Very low (~0.24-0.3%) indicating most return is from capital appreciation.
Pros: Good profit growth, infrastructure tailwinds, improving operational metrics.
Cons: Rich valuation, high expectations priced in. Any weakness in cargo volumes or macro slowdown could hurt sentiment.
📈 Technical / Positional Setup
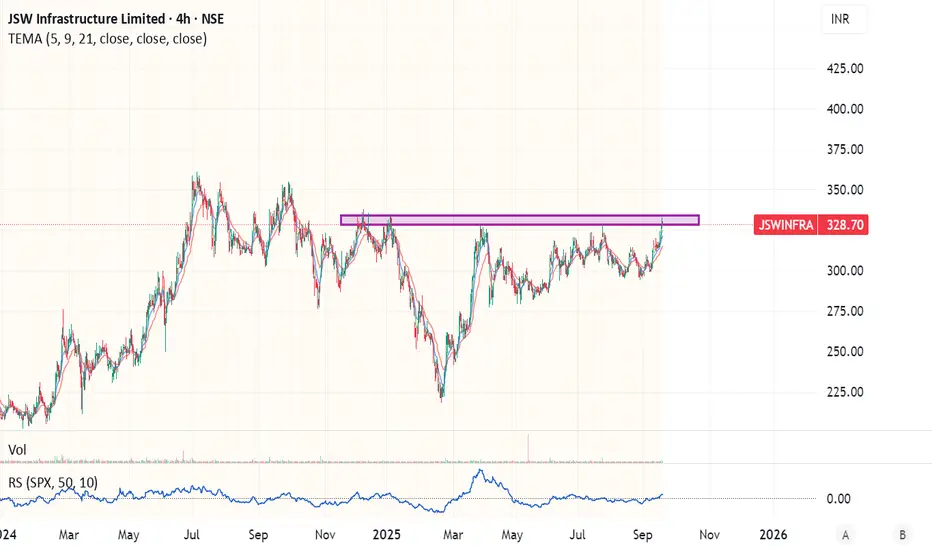
Based on the chart shared and corroborated with external technicals:
Resistance Zone: ~₹330-₹335 seems to be a critical resistance level (multiple past highs around that).
Support Zones: ~₹300-₹310 (recent pivot), deeper support around ₹280-₹290 if weakness.
Moving Averages: Short term EMAs seem aligned bullishly (from chart), price pushing above resistance, indicating breakout attempt.
Macd / Momentum: External sources show moving averages giving “Buy” signals; momentum indicators generally positive.
🎯 Trade Plan
Parameter Value
Entry On clean breakout above ~₹335 with confirmation (strong volume)
Stop-Loss Below support ~₹300 - ₹305 zone
Target 1 ~₹370-₹400 (next resistance zones)
Target 2 ~₹430-₹450 (extended if trend continues)
Risk Profile High: because valuation is stretched and driver (cargo volumes, infra spending) needs to sustain
Market Cap: ~ ₹69,000 Cr.
Revenue / Profit: Last reported revenue ~₹4,690 Cr, Profit ~₹1,614 Cr.
5-Yr Profit Growth: ~51.5% CAGR.
Valuation:
P/E is very high (in some sources ~186×) which suggests heavy premium pricing.
P/B ≈ 13.3×.
Returns: ROE ~14.5%, ROCE ~13.3%.
Dividend Yield: Very low (~0.24-0.3%) indicating most return is from capital appreciation.
Pros: Good profit growth, infrastructure tailwinds, improving operational metrics.
Cons: Rich valuation, high expectations priced in. Any weakness in cargo volumes or macro slowdown could hurt sentiment.
📈 Technical / Positional Setup
Based on the chart shared and corroborated with external technicals:
Resistance Zone: ~₹330-₹335 seems to be a critical resistance level (multiple past highs around that).
Support Zones: ~₹300-₹310 (recent pivot), deeper support around ₹280-₹290 if weakness.
Moving Averages: Short term EMAs seem aligned bullishly (from chart), price pushing above resistance, indicating breakout attempt.
Macd / Momentum: External sources show moving averages giving “Buy” signals; momentum indicators generally positive.
🎯 Trade Plan
Parameter Value
Entry On clean breakout above ~₹335 with confirmation (strong volume)
Stop-Loss Below support ~₹300 - ₹305 zone
Target 1 ~₹370-₹400 (next resistance zones)
Target 2 ~₹430-₹450 (extended if trend continues)
Risk Profile High: because valuation is stretched and driver (cargo volumes, infra spending) needs to sustain
Отказ от ответственности
Все виды контента, которые вы можете увидеть на TradingView, не являются финансовыми, инвестиционными, торговыми или любыми другими рекомендациями. Мы не предоставляем советы по покупке и продаже активов. Подробнее — в Условиях использования TradingView.
Отказ от ответственности
Все виды контента, которые вы можете увидеть на TradingView, не являются финансовыми, инвестиционными, торговыми или любыми другими рекомендациями. Мы не предоставляем советы по покупке и продаже активов. Подробнее — в Условиях использования TradingView.