Look at the Monthly and Weekly Graph and than consider the daily
many Chartist started to give sell call in Kotakbank..
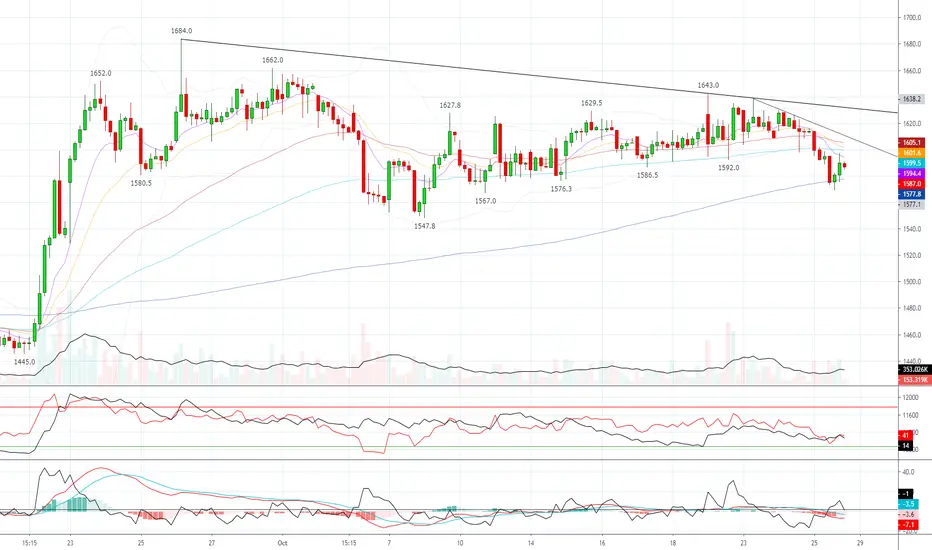
My conclusion---
1- Monthly graph given only two rate in swing high low one is upar side 1648 and 1555 in Low ( It means from the Lesting Kotak never Break its trend)
2- If any stock never break its Major trend from the listing than it not suppose to sell only buy in every deep.
3- There is two consideration in hourly graph ( Its has good support Near 1540-1560 and currently its trading 1590 so Buy above 1604 and stoploss would be 1580 closing base)
4- Buy Buy buy target will be 1648 and More
5- This is the chance to buy Kotak with stoploss and stoploss may not done if it will 1560 closing basis
Сделка активна
Сделка активна
Отказ от ответственности
Все виды контента, которые вы можете увидеть на TradingView, не являются финансовыми, инвестиционными, торговыми или любыми другими рекомендациями. Мы не предоставляем советы по покупке и продаже активов. Подробнее — в Условиях использования TradingView.
Отказ от ответственности
Все виды контента, которые вы можете увидеть на TradingView, не являются финансовыми, инвестиционными, торговыми или любыми другими рекомендациями. Мы не предоставляем советы по покупке и продаже активов. Подробнее — в Условиях использования TradingView.