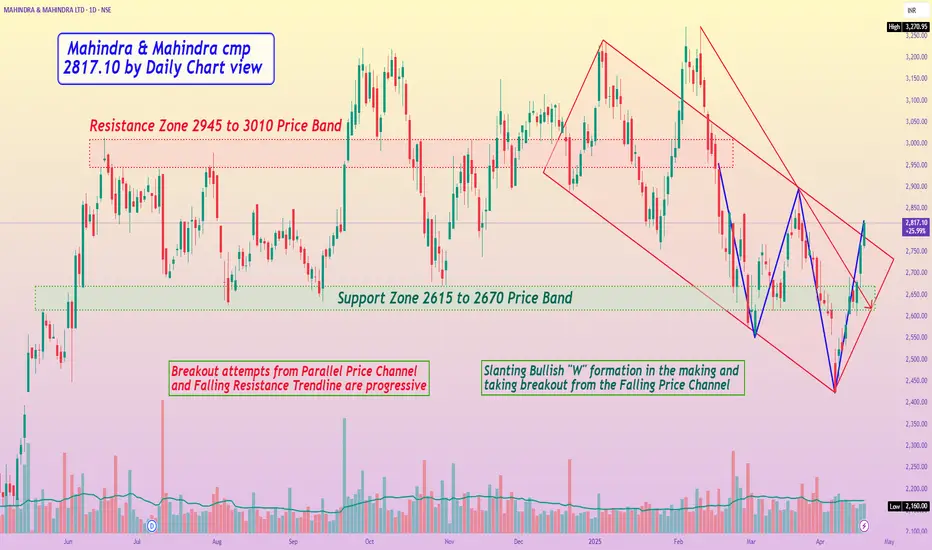
Mahindra & Mahindra cmp 2817.10 by Daily Chart view
- Support Zone 2615 to 2670 Price Band
- Resistance Zone 2945 to 3010 Price Band
- Volumes are seen to be getting in close sync with the average traded quantity
- Breakout attempts from Parallel Price Channel and Falling Resistance Trendline are progressive
- Slanting Bullish "W" formation in the making and taking breakout from the Falling Price Channel
Отказ от ответственности
Все виды контента, которые вы можете увидеть на TradingView, не являются финансовыми, инвестиционными, торговыми или любыми другими рекомендациями. Мы не предоставляем советы по покупке и продаже активов. Подробнее — в Условиях использования TradingView.
Отказ от ответственности
Все виды контента, которые вы можете увидеть на TradingView, не являются финансовыми, инвестиционными, торговыми или любыми другими рекомендациями. Мы не предоставляем советы по покупке и продаже активов. Подробнее — в Условиях использования TradingView.