Multi Commodity Exchange of India (MCX) is showing strong bullish momentum as it closes in on its all-time high. After a period of healthy consolidation, today's positive price action suggests the stock is preparing to challenge its key resistance level.
The Context: Consolidation Below the Peak
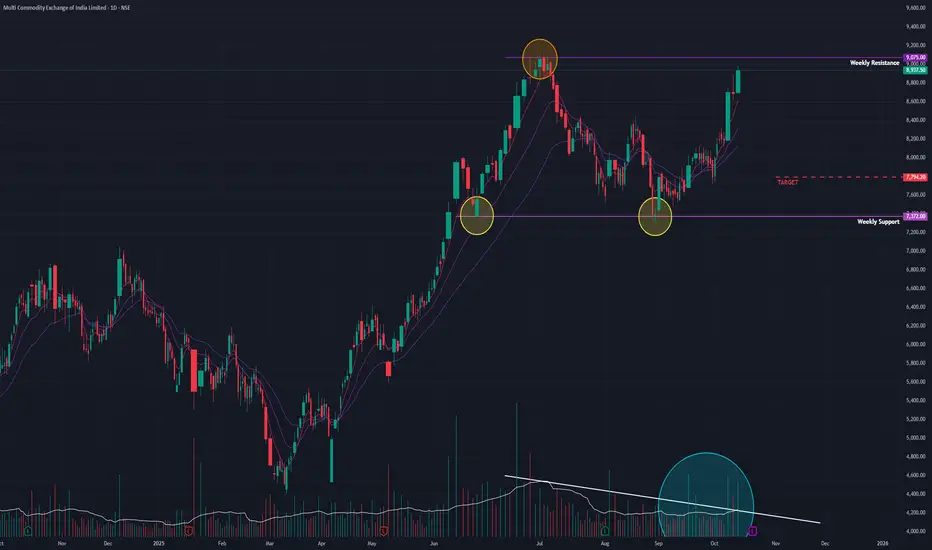
Following a strong bullish uptrend, MCX entered a sideways consolidation phase in June 2025. It registered a new All-Time High (ATH) in July 2025, which established a formidable resistance level that has capped all subsequent rallies.
Today, the stock showed renewed strength with a solid gain of +2.87% on good volume. This move has pushed the price to less than 2% below its ATH resistance, placing it on high alert for an imminent breakout attempt.
Underlying Technical Strength
The potential for a breakout is strongly supported by key technical indicators across multiple timeframes (Monthly, Weekly, and Daily):
- EMA Crossover: The short-term Exponential Moving Averages (EMAs) are in a bullish positive crossover state.
- Rising RSI: The Relative Strength Index (RSI) is rising, confirming that momentum is building.
These indicators suggest a broad-based strength that could fuel a move to new highs.
Outlook and Key Levels
The immediate path for MCX will be determined by its interaction with the ATH resistance.
- Bullish Breakout Scenario: A decisive close above the all-time high on strong volume would confirm a breakout and signal a continuation of the primary uptrend. The next potential target in this scenario would be the ₹10,800 level.
- Potential Pullback Scenario: If the stock fails to breach the resistance and loses momentum, it could pull back to test the lower end of its consolidation range, with the primary support level at ₹7,800.
In conclusion, MCX is coiled for a potentially significant move. The focus in the coming days should be squarely on the price and volume action at the all-time high resistance, as a breakout here would be a major bullish signal.
The Context: Consolidation Below the Peak
Following a strong bullish uptrend, MCX entered a sideways consolidation phase in June 2025. It registered a new All-Time High (ATH) in July 2025, which established a formidable resistance level that has capped all subsequent rallies.
Today, the stock showed renewed strength with a solid gain of +2.87% on good volume. This move has pushed the price to less than 2% below its ATH resistance, placing it on high alert for an imminent breakout attempt.
Underlying Technical Strength
The potential for a breakout is strongly supported by key technical indicators across multiple timeframes (Monthly, Weekly, and Daily):
- EMA Crossover: The short-term Exponential Moving Averages (EMAs) are in a bullish positive crossover state.
- Rising RSI: The Relative Strength Index (RSI) is rising, confirming that momentum is building.
These indicators suggest a broad-based strength that could fuel a move to new highs.
Outlook and Key Levels
The immediate path for MCX will be determined by its interaction with the ATH resistance.
- Bullish Breakout Scenario: A decisive close above the all-time high on strong volume would confirm a breakout and signal a continuation of the primary uptrend. The next potential target in this scenario would be the ₹10,800 level.
- Potential Pullback Scenario: If the stock fails to breach the resistance and loses momentum, it could pull back to test the lower end of its consolidation range, with the primary support level at ₹7,800.
In conclusion, MCX is coiled for a potentially significant move. The focus in the coming days should be squarely on the price and volume action at the all-time high resistance, as a breakout here would be a major bullish signal.
Disclaimer: This analysis is my personal view & for educational purposes only. They shall not be construed as trade or investment advice. Before making any financial decision, it is imperative that you consult with a qualified financial professional.
Отказ от ответственности
Все виды контента, которые вы можете увидеть на TradingView, не являются финансовыми, инвестиционными, торговыми или любыми другими рекомендациями. Мы не предоставляем советы по покупке и продаже активов. Подробнее — в Условиях использования TradingView.