MNQ (Micro Nasdaq 100 Futures) Trade Setup – 3H Timeframe
MNQ: Likely Retest of Nearest Support in Uptrend with Rebound Toward All-Time High
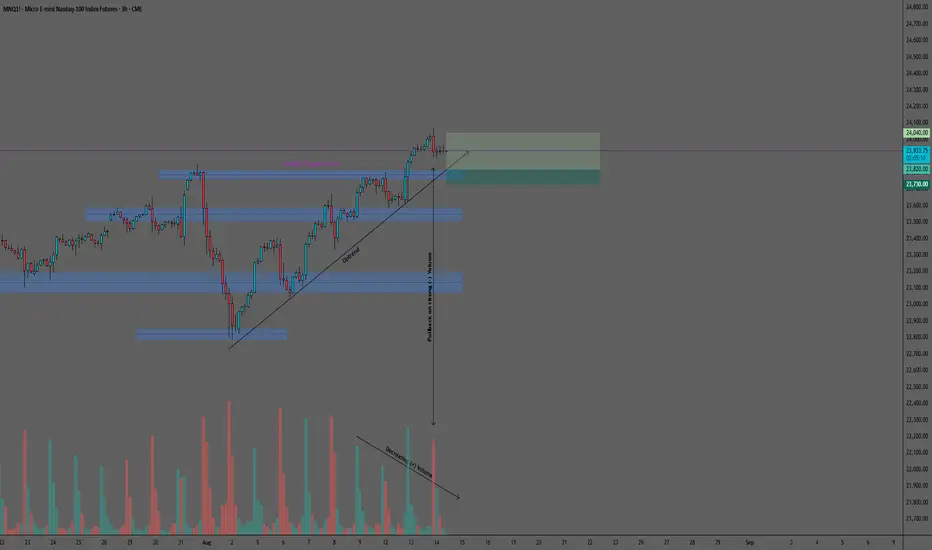
MNQ has been in a sustained uptrend since August 4, 2025, forming a clear sequence of higher highs and higher lows supported by constant positive volume inflow. On August 12, price broke above both the 23,800 resistance zone and the 23,848 all-time high following major news, with the breakout supported by strong buying volume.
The 3-hour chart shows that after the breakout, momentum has slowed and positive volume has gradually declined. A sharp spike in negative volume on August 13 suggests selling activity near the new high zone, increasing the likelihood of a pullback toward the 23,800 area—a strong liquidity level and former resistance now acting as support.
Illustrative Setup: A Buy Limit order at 23,820 positions the entry near the top of the 23,800 support zone, aiming to capture a rebound in line with the prevailing uptrend. A Stop Loss at 23,730 sits just below the support level, providing a clear invalidation point. The Take Profit target at 24,040 is set near the August 13 new all-time high (24,069), offering a favorable 2.44:1 reward-risk ratio.
Key considerations: The combination of an intact uptrend, a well-defined, strategic support zone, and the potential for a technical retest creates a bullish setup with multiple confirmations. However, given the proximity to all-time highs, traders should watch for volatility and / or potential consolidation before any new significant move takes place. Monitoring intraday volume dynamics can provide additional confirmation before entry.
This analysis is provided solely for educational and entertainment purposes and does not constitute any form of financial or investment advice. Always manage your risk and trade responsibly.
Сделка закрыта: достигнута стоп-лосс цена
The trade initially played out as expected, the buy limit entry being triggered at the top of the 23,800 support zone. Price then took off from there, only to reverse in the vicinity of the previous higher high. The 23,800 support zone was then challenged again before being broken to the downside. The protective stop set at 23.730 was taken out for a loss of -1R. This trade is over.Отказ от ответственности
Информация и публикации не предназначены для предоставления и не являются финансовыми, инвестиционными, торговыми или другими видами советов или рекомендаций, предоставленных или одобренных TradingView. Подробнее читайте в Условиях использования.
Отказ от ответственности
Информация и публикации не предназначены для предоставления и не являются финансовыми, инвестиционными, торговыми или другими видами советов или рекомендаций, предоставленных или одобренных TradingView. Подробнее читайте в Условиях использования.