Here is a detailed **technical analysis** of the **Motilal Oswal Financial Services Ltd (MOFSL)** daily chart
---
## 🔍 **Motilal Oswal – Daily Chart Technical Analysis**
### 🧩 **Chart Patterns Observed**
#### 1. **Falling Wedge Pattern (Bullish Reversal)**
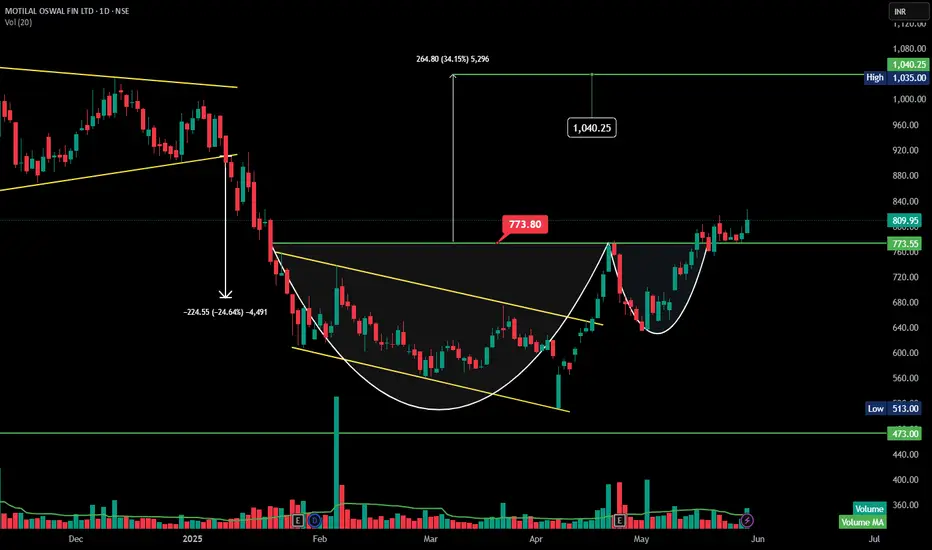
* After a significant downtrend of \~25% (from ₹909 to ₹685), the stock formed a **falling wedge**, a classic bullish reversal pattern.
* The breakout from this wedge marked the end of the downtrend and the start of base-building.
#### 2. **Cup and Handle Breakout**
* The stock formed a **smooth, rounded bottom** (the cup) between February and April.
* A shallow **handle formation** followed, confirming healthy consolidation before the breakout.
* **Breakout above ₹773.80**, which was the neckline of the cup pattern, has triggered bullish momentum.
---
### 📏 **Price Action & Measured Move**
| Component | Value |
| -------------------- | ------------------------------------------ |
| Cup Low | ₹513 |
| Neckline (Breakout) | ₹773.80 |
| Depth of Cup | ₹773.80 - ₹513 = ₹260 |
| Measured Move Target | ₹773.80 + ₹260 = **₹1040** *(minimum)* |
But the chart suggests a **larger swing target**:
* **Upside projection:** ₹773.80 + ₹264.80 = **₹1,040.25**
* This is based on broader trendline breakout from wedge to neckline move.
---
### 📊 **Volume Analysis**
Volume is missing during breakout
---
### 🔑 **Key Technical Levels**
| Level Type | Price (₹) |
| --------------------------- | --------- |
| Breakout Zone | 773.80 |
| Immediate Support | 773.55 |
| Strong Support (Trend Base) | 640 |
---
### 📌 **Technical Conclusion**
✅ **Bias:** Strongly **Bullish**
* The breakout above ₹773.80 confirms bullish momentum.
* With current price at ₹809.95, it has already moved \~36 points from the breakout — early entry window may be closing.
⚠️ **Next Steps:**
* Traders may **trail SL** to breakout zone (₹773–774).
* Watch for follow-through above ₹820 for confirmation toward **₹1,040 target**.
* Any retest of ₹780–790 zone may offer a **high-probability entry**.
---
### 🎯 **Trade Strategy**
| Strategy Type | Action |
| ------------- | ------------------------------------------ |
| Swing Trade | Buy on dips near ₹790–₹800; Target: ₹1,040 |
| Stop-loss | ₹772 (below breakout + handle support) |
| Risk-Reward | \~1:3 if targeting ₹1,040 |
---
---
## 🔍 **Motilal Oswal – Daily Chart Technical Analysis**
### 🧩 **Chart Patterns Observed**
#### 1. **Falling Wedge Pattern (Bullish Reversal)**
* After a significant downtrend of \~25% (from ₹909 to ₹685), the stock formed a **falling wedge**, a classic bullish reversal pattern.
* The breakout from this wedge marked the end of the downtrend and the start of base-building.
#### 2. **Cup and Handle Breakout**
* The stock formed a **smooth, rounded bottom** (the cup) between February and April.
* A shallow **handle formation** followed, confirming healthy consolidation before the breakout.
* **Breakout above ₹773.80**, which was the neckline of the cup pattern, has triggered bullish momentum.
---
### 📏 **Price Action & Measured Move**
| Component | Value |
| -------------------- | ------------------------------------------ |
| Cup Low | ₹513 |
| Neckline (Breakout) | ₹773.80 |
| Depth of Cup | ₹773.80 - ₹513 = ₹260 |
| Measured Move Target | ₹773.80 + ₹260 = **₹1040** *(minimum)* |
But the chart suggests a **larger swing target**:
* **Upside projection:** ₹773.80 + ₹264.80 = **₹1,040.25**
* This is based on broader trendline breakout from wedge to neckline move.
---
### 📊 **Volume Analysis**
Volume is missing during breakout
---
### 🔑 **Key Technical Levels**
| Level Type | Price (₹) |
| --------------------------- | --------- |
| Breakout Zone | 773.80 |
| Immediate Support | 773.55 |
| Strong Support (Trend Base) | 640 |
---
### 📌 **Technical Conclusion**
✅ **Bias:** Strongly **Bullish**
* The breakout above ₹773.80 confirms bullish momentum.
* With current price at ₹809.95, it has already moved \~36 points from the breakout — early entry window may be closing.
⚠️ **Next Steps:**
* Traders may **trail SL** to breakout zone (₹773–774).
* Watch for follow-through above ₹820 for confirmation toward **₹1,040 target**.
* Any retest of ₹780–790 zone may offer a **high-probability entry**.
---
### 🎯 **Trade Strategy**
| Strategy Type | Action |
| ------------- | ------------------------------------------ |
| Swing Trade | Buy on dips near ₹790–₹800; Target: ₹1,040 |
| Stop-loss | ₹772 (below breakout + handle support) |
| Risk-Reward | \~1:3 if targeting ₹1,040 |
---
Отказ от ответственности
Информация и публикации не предназначены для предоставления и не являются финансовыми, инвестиционными, торговыми или другими видами советов или рекомендаций, предоставленных или одобренных TradingView. Подробнее читайте в Условиях использования.
Отказ от ответственности
Информация и публикации не предназначены для предоставления и не являются финансовыми, инвестиционными, торговыми или другими видами советов или рекомендаций, предоставленных или одобренных TradingView. Подробнее читайте в Условиях использования.