The Nasdaq (US100) is currently at a pivotal point, trading just above a key support zone. A comprehensive analysis of the daily chart, as depicted in the screenshot, reveals several critical factors that could influence its short term trajectory.
Key Observations and Analysis
1. Price Action and Support Zone:
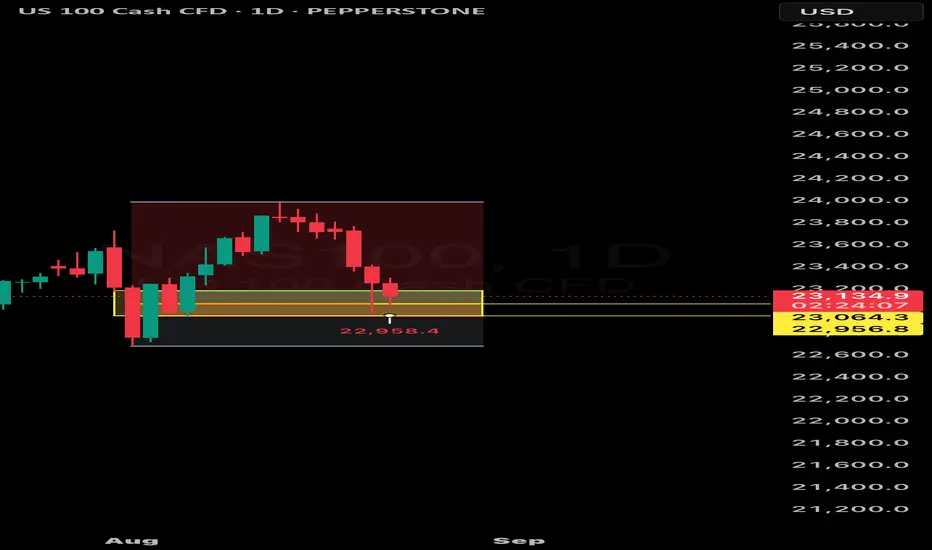
The Nasdaq has recently experienced a significant pullback from its recent highs, testing a critical support area. This zone, highlighted in the chart between approximately 22,800 and 23,000, is where buyers have previously stepped in, preventing further declines. The price has been consolidating within this range for several trading sessions, forming a potential "bottoming" pattern. The current price of 23,129.4, as shown, is hovering just above this level. This indicates a fierce battle between bulls and bears. A decisive break below this support would likely trigger further selling pressure, potentially targeting the next major support level around 22,000.
Conversely, a successful defense of this zone could provide the necessary foundation for a bullish reversal.
2. Candle Analysis (Bearish and Bullish Signals):
The chart shows a mix of bearish and bullish candlestick patterns.
* Bearish Candles: Several long red candles indicate strong selling pressure, particularly during the initial decline from the highs. These candles show that sellers were in control, pushing prices down aggressively.
* Bullish Candles: The appearance of smaller green candles within the support zone suggests that buyers are starting to show interest. These candles represent a slowing of the selling momentum and an increase in buying activity. The presence of a "hammer" or "doji"-like candle near the bottom of the range would be a bullish signal, indicating that sellers are losing control and a potential reversal is on the horizon.
3. Volume Analysis (Not Visible in Chart, but Crucial):
For a complete analysis, it is essential to consider volume.
* Declining Volume on the Pullback: If the recent decline occurred on declining volume, it would suggest that the selling pressure is weakening.
* Increasing Volume at Support: An increase in volume as the price tests the support zone would be a strong indicator of institutional buying. This would suggest that large players are accumulating positions at this level, providing a solid foundation for a potential rally.
Potential Scenarios and Future Outlook
Based on the current technical setup, two primary scenarios could unfold:
1. Bullish Reversal:
If the Nasdaq successfully holds the 22,800 - 23,000 support zone and breaks above the resistance of the current consolidation range, it would signal a potential return to its uptrend. The next key resistance level to watch would be around 23,750, a level where sellers previously entered the market. A break above this would likely clear the way for a test of the previous highs.
2. Bearish Continuation:
A decisive daily close below the 22,800 support level would be a major bearish signal. This would invalidate the current consolidation and could lead to a rapid move towards the next significant support level around 22,000. Traders would need to be cautious and consider a potential downside move in this scenario.
Conclusion
The Nasdaq (US100) is at a critical juncture. The price action within the 22,800 - 23,000 support zone will be the key to determining its next major move. A successful defense of this area could pave the way for a strong rebound, while a breach would likely signal a continuation of the downtrend. Traders should monitor price action and volume closely for confirmation of either scenario before making any trading decisions.
Key Observations and Analysis
1. Price Action and Support Zone:
The Nasdaq has recently experienced a significant pullback from its recent highs, testing a critical support area. This zone, highlighted in the chart between approximately 22,800 and 23,000, is where buyers have previously stepped in, preventing further declines. The price has been consolidating within this range for several trading sessions, forming a potential "bottoming" pattern. The current price of 23,129.4, as shown, is hovering just above this level. This indicates a fierce battle between bulls and bears. A decisive break below this support would likely trigger further selling pressure, potentially targeting the next major support level around 22,000.
Conversely, a successful defense of this zone could provide the necessary foundation for a bullish reversal.
2. Candle Analysis (Bearish and Bullish Signals):
The chart shows a mix of bearish and bullish candlestick patterns.
* Bearish Candles: Several long red candles indicate strong selling pressure, particularly during the initial decline from the highs. These candles show that sellers were in control, pushing prices down aggressively.
* Bullish Candles: The appearance of smaller green candles within the support zone suggests that buyers are starting to show interest. These candles represent a slowing of the selling momentum and an increase in buying activity. The presence of a "hammer" or "doji"-like candle near the bottom of the range would be a bullish signal, indicating that sellers are losing control and a potential reversal is on the horizon.
3. Volume Analysis (Not Visible in Chart, but Crucial):
For a complete analysis, it is essential to consider volume.
* Declining Volume on the Pullback: If the recent decline occurred on declining volume, it would suggest that the selling pressure is weakening.
* Increasing Volume at Support: An increase in volume as the price tests the support zone would be a strong indicator of institutional buying. This would suggest that large players are accumulating positions at this level, providing a solid foundation for a potential rally.
Potential Scenarios and Future Outlook
Based on the current technical setup, two primary scenarios could unfold:
1. Bullish Reversal:
If the Nasdaq successfully holds the 22,800 - 23,000 support zone and breaks above the resistance of the current consolidation range, it would signal a potential return to its uptrend. The next key resistance level to watch would be around 23,750, a level where sellers previously entered the market. A break above this would likely clear the way for a test of the previous highs.
2. Bearish Continuation:
A decisive daily close below the 22,800 support level would be a major bearish signal. This would invalidate the current consolidation and could lead to a rapid move towards the next significant support level around 22,000. Traders would need to be cautious and consider a potential downside move in this scenario.
Conclusion
The Nasdaq (US100) is at a critical juncture. The price action within the 22,800 - 23,000 support zone will be the key to determining its next major move. A successful defense of this area could pave the way for a strong rebound, while a breach would likely signal a continuation of the downtrend. Traders should monitor price action and volume closely for confirmation of either scenario before making any trading decisions.
Passionate about leveraging cutting edge technology and strategic business insights to drive profitability and innovation in the financial sector. Purely Artificial-Intelligence based data.
Отказ от ответственности
Все виды контента, которые вы можете увидеть на TradingView, не являются финансовыми, инвестиционными, торговыми или любыми другими рекомендациями. Мы не предоставляем советы по покупке и продаже активов. Подробнее — в Условиях использования TradingView.