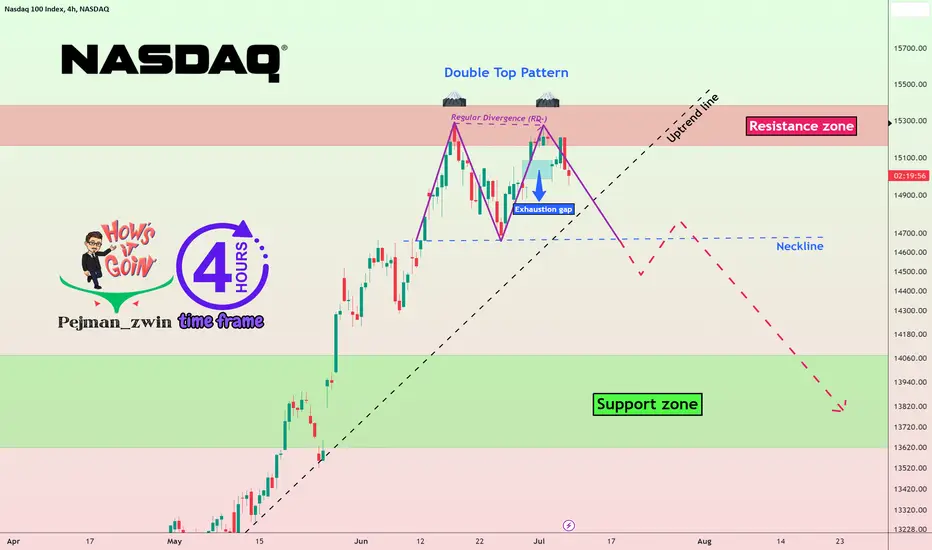
Nasdaq is moving near the 🔴resistance zone(15,385-$15,160)🔴, and the formation of an Exhaustion gap can be a 💡Sign💡 of the end of the upward trend of the Nasdaq these few weeks.
Also, due to the Regular Divergence(RD-) between two consecutive peaks, the possibility of forming a 🗻Double Top pattern🗻 is very high.
🔔I expect the Nasdaq to fall to at least the 🟢support zone($ 14,060-$ 13,610)🟢 after breaking the uptrend line and neckline.
Nasdaq 100 Index Analyze (NDXUSD), 4-hour time frame⏰.
Do not forget to put Stop loss for your positions (For every position that you want to open).
Please follow your strategy, this is just my Idea, and I will be glad to see your ideas in this post.
Please do not forget the ✅' like'✅ button 🙏😊 & Share it with your friends; thanks, and Trade safe.
Сделка активна
🎁Get a 20% Discount on your trading FEE on BYBIT:👉partner.bybit.com/b/PEJMANZWIN
Отказ от ответственности
Все виды контента, которые вы можете увидеть на TradingView, не являются финансовыми, инвестиционными, торговыми или любыми другими рекомендациями. Мы не предоставляем советы по покупке и продаже активов. Подробнее — в Условиях использования TradingView.