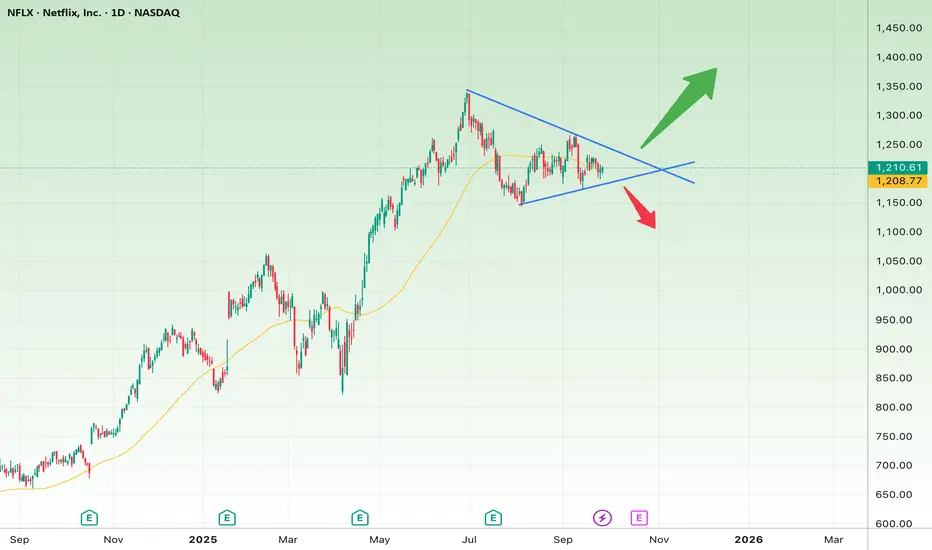
The Netflix (NFLX) daily chart is showing a symmetrical triangle pattern. This usually forms before a strong breakout, and right now price is sitting at a decision point.
🔎 Short-Term Outlook (1–3 weeks)
Pattern: Symmetrical triangle around $1,200
Bullish Scenario:
A breakout above the upper trendline ($1,230–$1,240) could trigger strong buying momentum.
Targets:
First target: $1,300
Second target: $1,350
Stop-loss: Below $1,180
Bearish Scenario:
A breakdown below the lower trendline ($1,190) may lead to increased selling pressure.
Targets:
First target: $1,120
Second target: $1,050
Stop-loss: Above $1,240
🔎 Long-Term Outlook (2–6 months)
The overall trend since late 2024 has been bullish, with the 50-day moving average still supporting price action.
Bullish Scenario:
A confirmed breakout and consolidation above $1,240 could pave the way toward:
First target: $1,400
Second target (long-term): $1,500
Bearish Scenario:
If the triangle breaks downward and price holds below $1,150, the medium-term bullish structure could collapse.
Targets:
$1,050
$950 (key long-term support)
Stop-loss (long-term): Below $1,150
📌 Summary:
In the short term, the $1,190–$1,240 range is the key decision zone.
In the long term, the bias remains bullish unless price loses $1,150.
Отказ от ответственности
Все виды контента, которые вы можете увидеть на TradingView, не являются финансовыми, инвестиционными, торговыми или любыми другими рекомендациями. Мы не предоставляем советы по покупке и продаже активов. Подробнее — в Условиях использования TradingView.
Отказ от ответственности
Все виды контента, которые вы можете увидеть на TradingView, не являются финансовыми, инвестиционными, торговыми или любыми другими рекомендациями. Мы не предоставляем советы по покупке и продаже активов. Подробнее — в Условиях использования TradingView.