📊 NIFTY 15-Min Trading Plan for 2-May-2025
(Chart-Based | Gap Opening = 100+ Points)
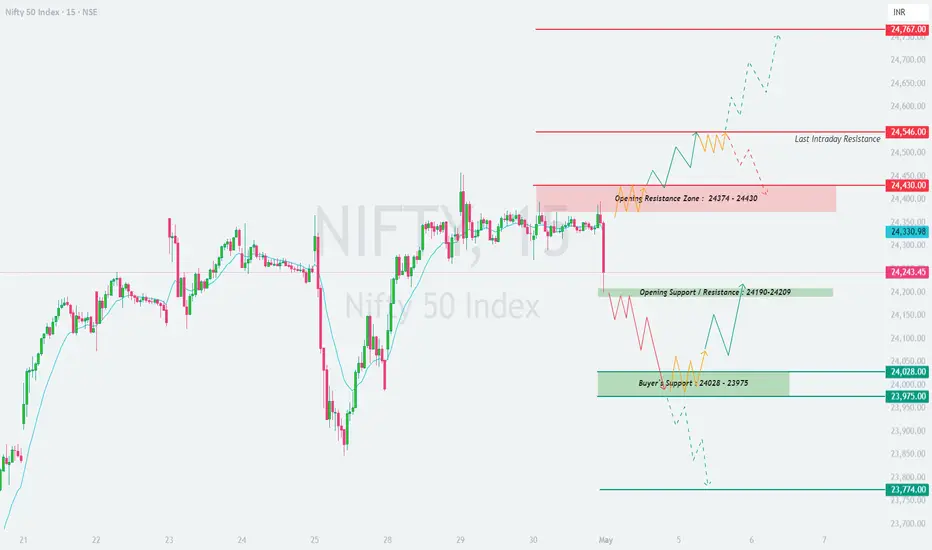
📍 Previous Close: 24,243.45
📌 Key Chart Zones & Levels:
🔴 Last Intraday Resistance: 24,546
🟥 Opening Resistance Zone: 24,430 – 24,374
🟩 Opening Support/Resistance Zone: 24,209 – 24,190
🟢 Buyer's Support Zone: 24,028 – 23,975
🔻 Extreme Downside Support: 23,774
🟥 Scenario 1: Gap-Up Opening (Above 24,430) 🚀
📚 Educational Insight: Gaps into resistance need extra caution. Early buyers often get trapped. Let the structure form before committing to trades.
🟨 Scenario 2: Flat Opening (Between 24,209 – 24,430) ⚖️
📚 Educational Insight: Neutral opens often give the best trade setups—but only after price reacts to zone boundaries. Wait for confirmation.
🟩 Scenario 3: Gap-Down Opening (Below 24,209) 📉
📚 Educational Insight: Gaps into demand zones offer great risk-reward, but only if supported by price confirmation. Avoid catching falling knives without structure.
🛡️ Options Risk Management Tips for Intraday Traders 🧠
📌 Summary & Conclusion 📝
✅ Gap-Up Opening: Watch 24,430–24,546 zone for reversal or breakout confirmation. Avoid aggressive longs without strength.
✅ Flat Opening: Neutral zone. Best setups may form after breakout/breakdown. Wait for edge-based reactions.
✅ Gap-Down Opening: Focus on 24,028–23,975 demand zone for reversal. Fresh shorts only below 23,975.
🎯 Trade with structure, confirmation, and risk control. Let price come to your plan—don’t chase emotions.
⚠️ Disclaimer:
I am not a SEBI-registered analyst. This analysis is intended solely for educational purposes. Please consult a certified financial advisor before making any trading or investment decisions.
(Chart-Based | Gap Opening = 100+ Points)
📍 Previous Close: 24,243.45
📌 Key Chart Zones & Levels:
🔴 Last Intraday Resistance: 24,546
🟥 Opening Resistance Zone: 24,430 – 24,374
🟩 Opening Support/Resistance Zone: 24,209 – 24,190
🟢 Buyer's Support Zone: 24,028 – 23,975
🔻 Extreme Downside Support: 23,774
🟥 Scenario 1: Gap-Up Opening (Above 24,430) 🚀
- [] If Nifty opens above 24,430, we are opening directly into the resistance supply zone. Avoid blind longs here as sellers may initially step in.
[] A sustainable bullish structure above 24,430 with follow-through candles and volume is a must for any breakout trade toward 24,546 (Last Intraday Resistance).
[] If price rejects the zone and slips back under 24,374, expect a pullback toward 24,330–24,243 zone.
[] For upside targets beyond 24,546, strong momentum must be visible. Only then can traders look for 24,767 as an extension level. - If the gap-up fades quickly and dips below 24,374, this is a warning for potential "gap fade" sell-off.
📚 Educational Insight: Gaps into resistance need extra caution. Early buyers often get trapped. Let the structure form before committing to trades.
🟨 Scenario 2: Flat Opening (Between 24,209 – 24,430) ⚖️
- [] A flat open puts Nifty inside the consolidation or decision zone. Expect both buyers and sellers to remain active here.
[] Avoid early trades in the first 15–30 minutes. Let price test the upper resistance (24,430) or lower support (24,209).
[] If Nifty breaks and sustains above 24,430, trend may attempt to reach 24,546 and possibly 24,767.
[] If Nifty dips below 24,209, a quick move toward 24,028 – 23,975 zone is possible. Look for bullish reversal candles here before buying. - Range-bound price action likely unless breakout or breakdown triggers with strength. Stay reactive, not predictive.
📚 Educational Insight: Neutral opens often give the best trade setups—but only after price reacts to zone boundaries. Wait for confirmation.
🟩 Scenario 3: Gap-Down Opening (Below 24,209) 📉
- [] A gap-down below 24,209 brings immediate attention to 24,028 – 23,975, a critical Buyer's Support Zone.
[] If price shows reversal patterns (bullish engulfing, hammer) near this zone with good volume, long entries with stops below 23,975 are favorable.
[] Failing to hold 23,975 will open gates to a deeper fall toward 23,774, the next visual support.
[] Avoid aggressive long trades just because prices are lower—structure matters more than location. - Breakdown below 23,975 with strong bearish candles can trigger fresh short trades targeting 23,774 or even lower zones.
📚 Educational Insight: Gaps into demand zones offer great risk-reward, but only if supported by price confirmation. Avoid catching falling knives without structure.
🛡️ Options Risk Management Tips for Intraday Traders 🧠
- [] Never trade naked options blindly in high IV zones. Use spreads (like bull call or bear put) for defined risk setups.
[] Don’t jump into trades in the first 5–10 minutes—option premiums are inflated. Let them settle.
[] Always trade with a defined stop loss. Avoid averaging losses.
[] Keep daily loss limits (e.g., 2% of capital) and walk away once hit. Discipline is key.
[] Avoid overleveraging OTM options; go ITM for directional conviction or use hedge legs.
[] Know when NOT to trade—sideways and indecisive markets destroy premium buyers. - Don’t convert intraday trades into swings emotionally. Stick to your plan.
📌 Summary & Conclusion 📝
✅ Gap-Up Opening: Watch 24,430–24,546 zone for reversal or breakout confirmation. Avoid aggressive longs without strength.
✅ Flat Opening: Neutral zone. Best setups may form after breakout/breakdown. Wait for edge-based reactions.
✅ Gap-Down Opening: Focus on 24,028–23,975 demand zone for reversal. Fresh shorts only below 23,975.
🎯 Trade with structure, confirmation, and risk control. Let price come to your plan—don’t chase emotions.
⚠️ Disclaimer:
I am not a SEBI-registered analyst. This analysis is intended solely for educational purposes. Please consult a certified financial advisor before making any trading or investment decisions.
Отказ от ответственности
Информация и публикации не предназначены для предоставления и не являются финансовыми, инвестиционными, торговыми или другими видами советов или рекомендаций, предоставленных или одобренных TradingView. Подробнее читайте в Условиях использования.
Отказ от ответственности
Информация и публикации не предназначены для предоставления и не являются финансовыми, инвестиционными, торговыми или другими видами советов или рекомендаций, предоставленных или одобренных TradingView. Подробнее читайте в Условиях использования.