Hello fellow traders! Wishing you happy trading, may the charts guide you well. Today, we’ll discuss price action and how it helps us in our routine trading, And very Grateful to TradingView for providing such powerful charts that make understanding price action simpler
Introduction--::
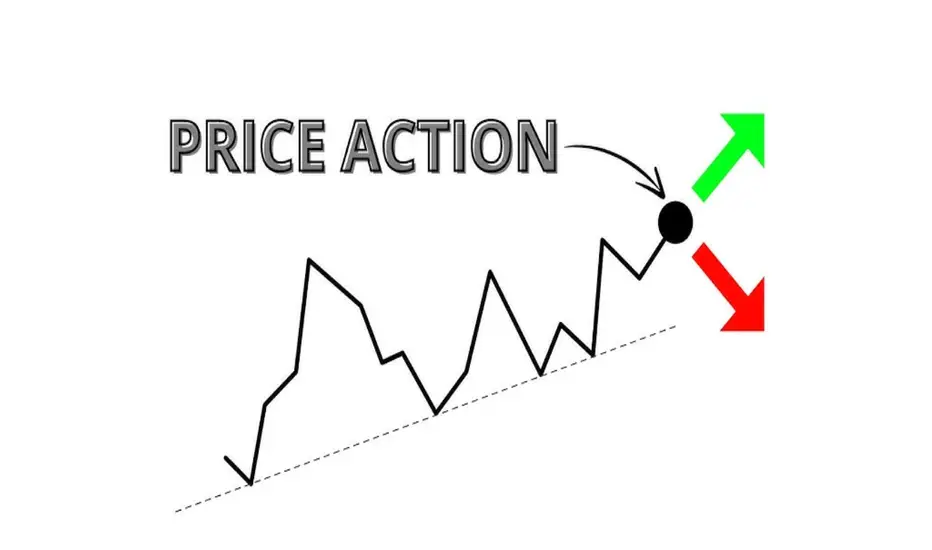
In the trading world, price is the ultimate truth. While many traders rely on moving averages, oscillators, and other indicators, seasoned professionals often focus on something simpler yet more powerful: price action.
Price action is the study of how price moves on a chart—through candles, patterns, and levels. It reflects the ongoing battle between buyers and sellers, revealing the sentiment of the market in real time.
Unlike indicators, which are often lagging, price action is immediate, showing what’s happening now. By learning to read it, traders gain a clear picture of market psychology, trends, and potential reversals.
1. What is Price Action?
Price action trading is the art of making trading decisions based solely on the price chart, without relying heavily on external tools. Every candle, every bar, every level tells a story.
Key idea: Price action is the reflection of supply and demand.
When buyers dominate---price rises.
When sellers dominate---price falls.
When buyers and sellers balance---price consolidates.
A skilled trader can “read” these shifts and decide when to enter or exit trades.
2. Core Elements of Price Action
🔼Market Structure
Uptrend: Higher highs, higher lows.
Downtrend: Lower highs, lower lows.
Range/Consolidation: Price moves sideways between support and resistance.
Example: On a daily NIFTY chart, repeated higher highs indicate a bullish trend.
🔼Support & Resistance Levels
Support = price levels where buying pressure appears.
Resistance = price levels where selling pressure appears.
Tip: Look for areas where price has reacted multiple times.
🔼Candlestick Patterns
Pin Bar / Hammer / Shooting Star: Reversal signals.
Engulfing Candles: Momentum shift between buyers and sellers.
Doji: Indecision in the market, often preceding a reversal.
🔼Supply & Demand Zones
Supply zone = excess selling; price likely to fall.
Demand zone = excess buying; price likely to rise.
Example: A BTC chart showing a strong rejection from a previous demand zone.
3. Popular Price Action Patterns
Pin Bar Rejection: Shows price rejection from a key level.
Engulfing Candles: Bullish or bearish, indicate strong reversals.
Breakouts and Retests: Price breaks a level, retraces, then continues the trend.
Chart Patterns: Head & Shoulders, Triangles, Flags, Pennants.
4. How Traders Use Price Action
🔼Identifying Entries and Exits
Enter near support in an uptrend after bullish candle confirmation.
Exit near resistance or after a reversal candle forms.
🔼Stop-Loss and Risk Management
Place stop-loss just beyond the invalidation point (e.g., below pin bar tail).
🔼Trend Following
Join the trend only after a clear price action signal.
🔼Volume Confirmation
Higher volume on breakout/reversal signals strengthens the validity.
5. Advantages of Price Action Trading
Simplicity: No cluttered indicators.
Flexibility: Works on any market or timeframe.
Clarity: Shows real-time market psychology.
Versatility: Applicable to intraday trading, swing trading, or investing.
6. Limitations & Common Mistakes
Subjectivity: Interpretation can differ between traders.
Overtrading: Seeing patterns everywhere can lead to losses.
Requires Discipline: Consistency and patience are key.
Practice Needed: Cannot learn overnight; requires chart study.
7. Real-World Example
Imagine NIFTY is trending upward. It touches a prior resistance zone but forms a bullish engulfing candle at a support level. A price action trader sees this as:
Buyers are strong.
Trend likely to continue.
Entry near support, stop-loss just below candle tail, target near next resistance.
This decision is based purely on price movement, no indicators required.
Conclusion
Price action is the language of the market. Every candle, pattern, and level tells a story about what traders are thinking and doing. By learning to read it, you can trade with confidence, clarity, and simplicity.
Remember: Indicators lag, but price is always present. If you master price action, you master the market’s story itself.
Best Regards- Amit
Introduction--::
In the trading world, price is the ultimate truth. While many traders rely on moving averages, oscillators, and other indicators, seasoned professionals often focus on something simpler yet more powerful: price action.
Price action is the study of how price moves on a chart—through candles, patterns, and levels. It reflects the ongoing battle between buyers and sellers, revealing the sentiment of the market in real time.
Unlike indicators, which are often lagging, price action is immediate, showing what’s happening now. By learning to read it, traders gain a clear picture of market psychology, trends, and potential reversals.
1. What is Price Action?
Price action trading is the art of making trading decisions based solely on the price chart, without relying heavily on external tools. Every candle, every bar, every level tells a story.
Key idea: Price action is the reflection of supply and demand.
When buyers dominate---price rises.
When sellers dominate---price falls.
When buyers and sellers balance---price consolidates.
A skilled trader can “read” these shifts and decide when to enter or exit trades.
2. Core Elements of Price Action
🔼Market Structure
Uptrend: Higher highs, higher lows.
Downtrend: Lower highs, lower lows.
Range/Consolidation: Price moves sideways between support and resistance.
Example: On a daily NIFTY chart, repeated higher highs indicate a bullish trend.
🔼Support & Resistance Levels
Support = price levels where buying pressure appears.
Resistance = price levels where selling pressure appears.
Tip: Look for areas where price has reacted multiple times.
🔼Candlestick Patterns
Pin Bar / Hammer / Shooting Star: Reversal signals.
Engulfing Candles: Momentum shift between buyers and sellers.
Doji: Indecision in the market, often preceding a reversal.
🔼Supply & Demand Zones
Supply zone = excess selling; price likely to fall.
Demand zone = excess buying; price likely to rise.
Example: A BTC chart showing a strong rejection from a previous demand zone.
3. Popular Price Action Patterns
Pin Bar Rejection: Shows price rejection from a key level.
Engulfing Candles: Bullish or bearish, indicate strong reversals.
Breakouts and Retests: Price breaks a level, retraces, then continues the trend.
Chart Patterns: Head & Shoulders, Triangles, Flags, Pennants.
4. How Traders Use Price Action
🔼Identifying Entries and Exits
Enter near support in an uptrend after bullish candle confirmation.
Exit near resistance or after a reversal candle forms.
🔼Stop-Loss and Risk Management
Place stop-loss just beyond the invalidation point (e.g., below pin bar tail).
🔼Trend Following
Join the trend only after a clear price action signal.
🔼Volume Confirmation
Higher volume on breakout/reversal signals strengthens the validity.
5. Advantages of Price Action Trading
Simplicity: No cluttered indicators.
Flexibility: Works on any market or timeframe.
Clarity: Shows real-time market psychology.
Versatility: Applicable to intraday trading, swing trading, or investing.
6. Limitations & Common Mistakes
Subjectivity: Interpretation can differ between traders.
Overtrading: Seeing patterns everywhere can lead to losses.
Requires Discipline: Consistency and patience are key.
Practice Needed: Cannot learn overnight; requires chart study.
7. Real-World Example
Imagine NIFTY is trending upward. It touches a prior resistance zone but forms a bullish engulfing candle at a support level. A price action trader sees this as:
Buyers are strong.
Trend likely to continue.
Entry near support, stop-loss just below candle tail, target near next resistance.
This decision is based purely on price movement, no indicators required.
Conclusion
Price action is the language of the market. Every candle, pattern, and level tells a story about what traders are thinking and doing. By learning to read it, you can trade with confidence, clarity, and simplicity.
Remember: Indicators lag, but price is always present. If you master price action, you master the market’s story itself.
Best Regards- Amit
Отказ от ответственности
Все виды контента, которые вы можете увидеть на TradingView, не являются финансовыми, инвестиционными, торговыми или любыми другими рекомендациями. Мы не предоставляем советы по покупке и продаже активов. Подробнее — в Условиях использования TradingView.
Отказ от ответственности
Все виды контента, которые вы можете увидеть на TradingView, не являются финансовыми, инвестиционными, торговыми или любыми другими рекомендациями. Мы не предоставляем советы по покупке и продаже активов. Подробнее — в Условиях использования TradingView.