Hi, friends
Today we saw negative gap down opening and market recover very positively after a one deep.
But at the end of the day Nifty index gave negative close.
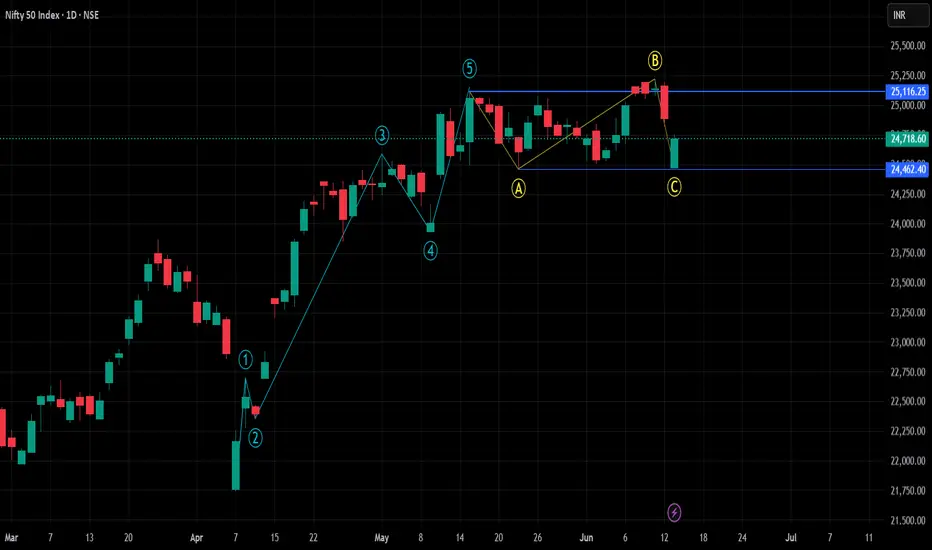
After impulsive move , we can see running flat type of corrective pattern that follows the 3-3-5 wave structure. It's similar to an expanded flat, where Wave B extends beyond the start of Wave A, but unlike the expanded flat, Wave C fails to reach the end of Wave A. This means the price retraces beyond the 100% level of Wave A in Wave B, but the subsequent Wave C doesn't complete the correction by exceeding Wave A's end point.
here i am assuming wave c is over . here i marked bottom of wave A, if low of wave A breaks then the running flat pattern will be invalided.
Today we saw negative gap down opening and market recover very positively after a one deep.
But at the end of the day Nifty index gave negative close.
After impulsive move , we can see running flat type of corrective pattern that follows the 3-3-5 wave structure. It's similar to an expanded flat, where Wave B extends beyond the start of Wave A, but unlike the expanded flat, Wave C fails to reach the end of Wave A. This means the price retraces beyond the 100% level of Wave A in Wave B, but the subsequent Wave C doesn't complete the correction by exceeding Wave A's end point.
here i am assuming wave c is over . here i marked bottom of wave A, if low of wave A breaks then the running flat pattern will be invalided.
Сделка активна
Отказ от ответственности
Все виды контента, которые вы можете увидеть на TradingView, не являются финансовыми, инвестиционными, торговыми или любыми другими рекомендациями. Мы не предоставляем советы по покупке и продаже активов. Подробнее — в Условиях использования TradingView.
Отказ от ответственности
Все виды контента, которые вы можете увидеть на TradingView, не являются финансовыми, инвестиционными, торговыми или любыми другими рекомендациями. Мы не предоставляем советы по покупке и продаже активов. Подробнее — в Условиях использования TradingView.