✅ Current Market Status:
Closing Price: ₹24,972.50
Change: –95.20 points
Percentage Change: –0.38%
Day’s Range: ₹24,905.60 – ₹25,095.10
52-Week Range: ₹19,638.30 – ₹25,194.60
🔍 Key Technical Levels:
📌 Support Zones:
Support 1: ₹24,900 – Intraday low and key psychological level
Support 2: ₹24,750 – Previous breakout zone
Support 3: ₹24,500 – Short-term trendline base
📌 Resistance Zones:
Resistance 1: ₹25,100 – Day’s high and minor barrier
Resistance 2: ₹25,200 – All-time high
Resistance 3: ₹25,500 – Next potential rally target if breakout succeeds
🕯️ Candlestick Pattern:
Recent Candle: Bearish candle after range-bound session
Price Action: Failed to sustain above ₹25,100
Implication: Weakness around highs, possible pullback toward support
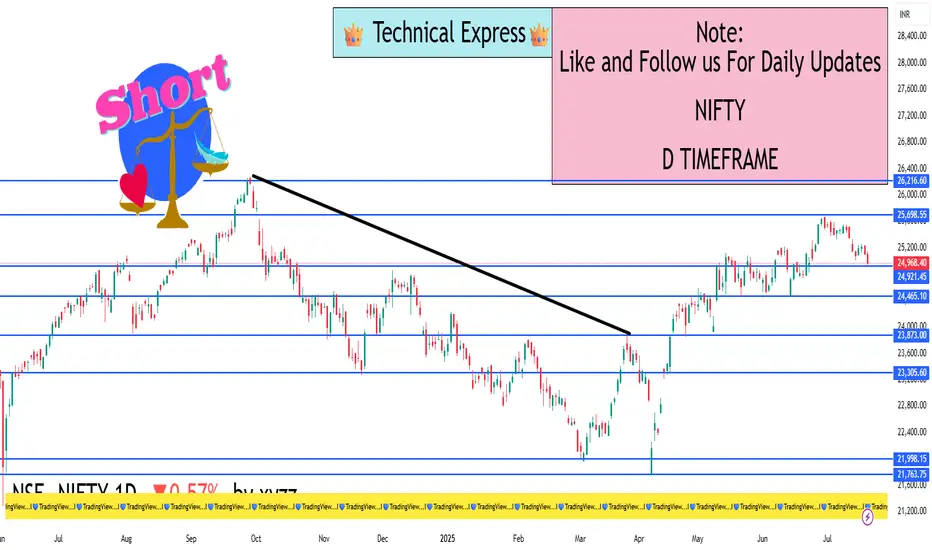
📊 Market Structure Summary:
Nifty formed a double top near ₹25,200, indicating exhaustion
Currently testing ₹24,900 – if broken, next support is ₹24,750
A breakout will only be valid above ₹25,200 with strong volume
🧠 Institutional Behavior:
Likely profit booking near highs
No major signs of heavy accumulation
May re-enter above ₹25,200 or below ₹24,500 for value buying
🔚 Summary:
🔴 Short-Term Bias: Slightly Bearish
🟡 Watch Levels: ₹24,900 (support) and ₹25,200 (resistance)
✅ Buyers: Wait for breakout above ₹25,200
⚠️ Sellers: Watch for breakdown below ₹24,900 or ₹24,750
Closing Price: ₹24,972.50
Change: –95.20 points
Percentage Change: –0.38%
Day’s Range: ₹24,905.60 – ₹25,095.10
52-Week Range: ₹19,638.30 – ₹25,194.60
🔍 Key Technical Levels:
📌 Support Zones:
Support 1: ₹24,900 – Intraday low and key psychological level
Support 2: ₹24,750 – Previous breakout zone
Support 3: ₹24,500 – Short-term trendline base
📌 Resistance Zones:
Resistance 1: ₹25,100 – Day’s high and minor barrier
Resistance 2: ₹25,200 – All-time high
Resistance 3: ₹25,500 – Next potential rally target if breakout succeeds
🕯️ Candlestick Pattern:
Recent Candle: Bearish candle after range-bound session
Price Action: Failed to sustain above ₹25,100
Implication: Weakness around highs, possible pullback toward support
📊 Market Structure Summary:
Nifty formed a double top near ₹25,200, indicating exhaustion
Currently testing ₹24,900 – if broken, next support is ₹24,750
A breakout will only be valid above ₹25,200 with strong volume
🧠 Institutional Behavior:
Likely profit booking near highs
No major signs of heavy accumulation
May re-enter above ₹25,200 or below ₹24,500 for value buying
🔚 Summary:
🔴 Short-Term Bias: Slightly Bearish
🟡 Watch Levels: ₹24,900 (support) and ₹25,200 (resistance)
✅ Buyers: Wait for breakout above ₹25,200
⚠️ Sellers: Watch for breakdown below ₹24,900 or ₹24,750
I built a Buy & Sell Signal Indicator with 85% accuracy.
📈 Get access via DM or
WhatsApp: wa.link/d997q0
Contact - +91 76782 40962
| Email: techncialexpress@gmail.com
| Script Coder | Trader | Investor | From India
📈 Get access via DM or
WhatsApp: wa.link/d997q0
Contact - +91 76782 40962
| Email: techncialexpress@gmail.com
| Script Coder | Trader | Investor | From India
Похожие публикации
Отказ от ответственности
Информация и публикации не предназначены для предоставления и не являются финансовыми, инвестиционными, торговыми или другими видами советов или рекомендаций, предоставленных или одобренных TradingView. Подробнее читайте в Условиях использования.