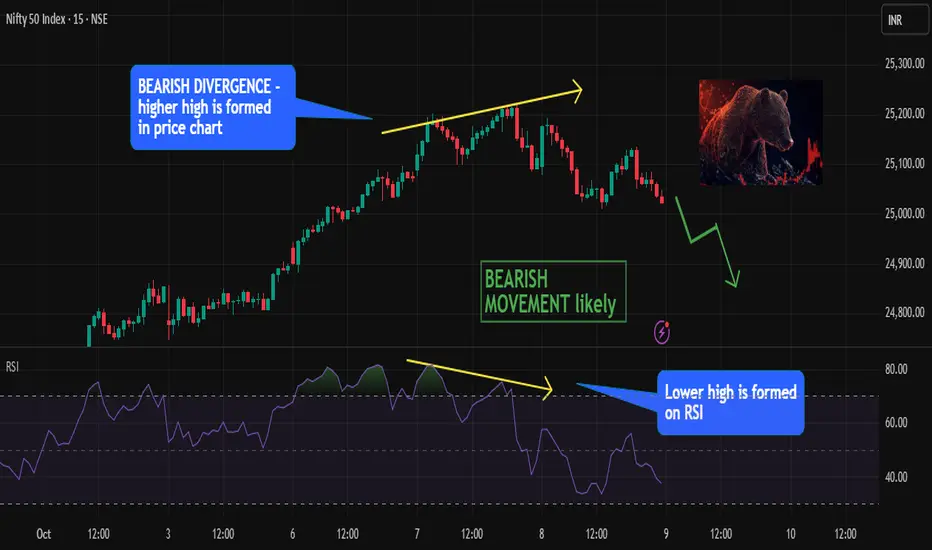
Nifty 50 (INDEX:NIFTY) is flashing a bearish divergence signal on the daily chart — a classic early warning of potential trend exhaustion.
📉 What’s Happening:
Price has made a higher high, reflecting continued bullish momentum on the surface.
However, the RSI (Relative Strength Index) has formed a lower high, showing weakening internal strength and momentum loss.
This bearish divergence between price and RSI often precedes a short-term reversal or correction phase.
🧩 Interpretation:
This setup suggests that even though price continues climbing, buying momentum is fading. Bulls may be losing strength, and bears could soon take control — especially if price fails to sustain above key resistance zones or shows a bearish confirmation candle in the coming sessions.
🎯 Target: 24,800
⛔ Stop Loss: 25,220
My Social Media links :
📥 Instagram - instagram.com/sagar_trademaster/
📥 Youtube - youtube.com/@TruthfulTrader
📥 Instagram - instagram.com/sagar_trademaster/
📥 Youtube - youtube.com/@TruthfulTrader
Отказ от ответственности
Все виды контента, которые вы можете увидеть на TradingView, не являются финансовыми, инвестиционными, торговыми или любыми другими рекомендациями. Мы не предоставляем советы по покупке и продаже активов. Подробнее — в Условиях использования TradingView.