📘 NIFTY – TRADING PLAN for 30-May-2025
🕒 Based on 15-minute Chart Analysis
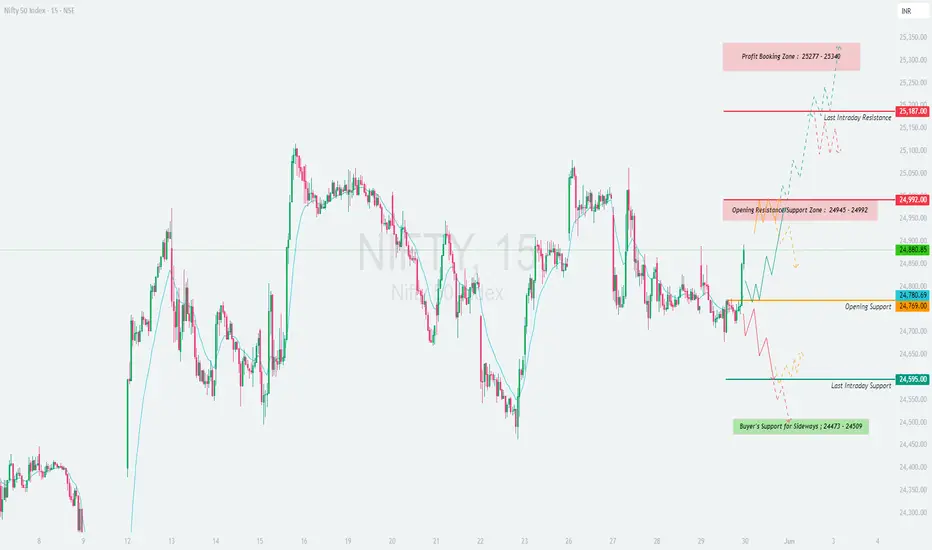
📍 Gap Opening Threshold: 100+ points from previous close of 24,880.85
🕒 Based on 15-minute Chart Analysis
📍 Gap Opening Threshold: 100+ points from previous close of 24,880.85
- 🔼 GAP-UP OPENING (Above 24,992+):
If Nifty opens above the Opening Resistance zone (24,945 – 24,992), it signals potential bullish continuation with strong upward momentum.
✅ Plan of Action:
• Wait for a 15-min candle close above 24,992 for breakout confirmation.
• Once confirmed, long trades may be initiated with upside targets:
→ 25,187 (Last Intraday Resistance)
→ 25,277 – 25,340 (Profit Booking Zone)
• Ideal stop-loss should be just below the breakout candle or beneath the 24,992 zone.
• If Nifty approaches 25,187 too quickly after open, expect minor profit booking or sideways move. Avoid aggressive buying near this resistance without proper structure.
🧠 Educational Insight: A gap-up above resistance is strong only if volume confirms and price sustains. Avoid chasing spikes; instead, wait for retest or consolidation above breakout levels to increase probability of success.
- ⚖️ FLAT OPENING (Between 24,780 – 24,945):
A flat open in this zone keeps the index in a balanced state with both opportunities and risks. Price action will dictate the day’s trend.
✅ Plan of Action:
• Mark the Opening Support: 24,780
• Mark the Resistance Supply zone: 24,945 – 24,992
• Wait for a range breakout:
→ Above 24,992 → Go long (targets: 25,187 → 25,340)
→ Below 24,780 → Go short (targets: 24,595 → 24,473)
• Do not trade within this zone unless price structure is clear and directional.
• Look for rejection wicks or engulfing patterns near support/resistance for potential scalps.
🧠 Educational Insight: Sideways zones are where traders lose most of their capital. Wait for confirmation before jumping in. A “No Trade” decision is also a trade that protects capital.
- 🔽 GAP-DOWN OPENING (Below 24,680):
A gap-down of more than 100 points brings Nifty near key supports: 24,595 (Last Intraday Support) and deeper into Buyer’s Support Zone (24,473 – 24,509).
✅ Plan of Action:
• Observe price behavior near 24,595.
• If this level holds, and you spot bullish reversal signs (hammer, bullish engulfing), go long toward:
→ 24,780 (Opening Support)
→ 24,880 (Previous Close)
• If price breaks below 24,473 with strong bearish candle, it opens up shorting possibilities with deeper targets.
• Stop-loss for reversal longs = below 24,473; for breakdown shorts = above 24,595.
• Avoid trading immediately at open; let the first 15–30 min range develop for clearer direction.
🧠 Educational Insight: Demand zones are highly reactive. Let the market show whether buyers are stepping in or fleeing. React, don’t predict.
🛡 RISK MANAGEMENT TIPS FOR OPTIONS TRADERS:
✅ Always use 15-min confirmation candles before taking a directional position.
✅ Don’t buy far OTM options post-gap openings; use near ATM or spreads to control premium decay.
✅ Define your loss limit for the day and stick to it. One wrong revenge trade can ruin weeks of gains.
✅ Keep position sizing small on volatile or event days — focus on surviving first, thriving later.
✅ Use option spreads like debit spreads to reduce theta exposure during sideways market phases.
📊 SUMMARY & CONCLUSION:
• 🟢 Bullish Scenario: Above 24,992 → Targets: 25,187 / 25,340**
• 🔴 Bearish Scenario: Below 24,595 → Targets: 24,509 / 24,473**
• 🟧 Neutral Zone: 24,780 – 24,945 → Wait for breakout direction
• 🟩 Support Levels: 24,780 / 24,595 / 24,473
• 🟥 Resistance Levels: 24,992 / 25,187 / 25,340
• 🧠 Key Strategy: Avoid emotional trading during volatile opening. Wait, confirm, then act.
✨ Final Word: Trading is a skill of patience and preparation. Let levels guide you, not assumptions. The market rewards precision, not prediction.
📢 DISCLAIMER: I am not a SEBI-registered analyst. This trading plan is intended solely for educational purposes. Please consult your financial advisor before making any trading or investment decisions. Trade wisely. 📉📈
Отказ от ответственности
Информация и публикации не предназначены для предоставления и не являются финансовыми, инвестиционными, торговыми или другими видами советов или рекомендаций, предоставленных или одобренных TradingView. Подробнее читайте в Условиях использования.
Отказ от ответственности
Информация и публикации не предназначены для предоставления и не являются финансовыми, инвестиционными, торговыми или другими видами советов или рекомендаций, предоставленных или одобренных TradingView. Подробнее читайте в Условиях использования.