📈 11-Day Technical Overview
Over the past 11 trading days, the index has experienced a modest upward movement, indicating a neutral to mildly bullish trend. Key technical indicators suggest a balanced market sentiment:
Relative Strength Index (RSI): Hovering around neutral levels, indicating neither overbought nor oversold conditions.
Moving Average Convergence Divergence (MACD): Currently showing a bullish crossover, suggesting potential upward momentum.
Average Directional Index (ADX): At approximately 22.69, with a Positive Directional Indicator (PDI) at 27.41 and a Negative Directional Indicator (MDI) at 14.54, indicating a mild bullish trend.
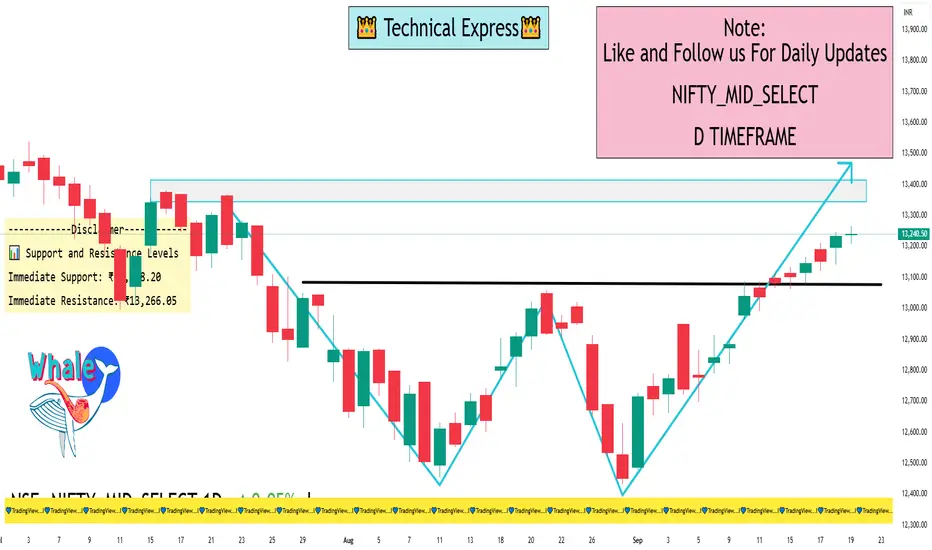
📊 Support and Resistance Levels
Immediate Support: ₹13,208.20
Immediate Resistance: ₹13,266.05
A breakout above the resistance level could signal a continuation of the upward trend, while a dip below support may indicate a potential reversal.
📌 Investment Options
Investors interested in gaining exposure to the Nifty Midcap Select Index can consider the following options:
Exchange-Traded Funds (ETFs): These funds replicate the performance of the index and can be traded on the stock exchange.
Index Funds: Mutual funds that aim to mirror the index's performance.
Futures & Options: Derivative contracts based on the index, suitable for more experienced investors.
Direct Stock Investment: Investing in the constituent stocks of the index in the same proportion as the index.
Over the past 11 trading days, the index has experienced a modest upward movement, indicating a neutral to mildly bullish trend. Key technical indicators suggest a balanced market sentiment:
Relative Strength Index (RSI): Hovering around neutral levels, indicating neither overbought nor oversold conditions.
Moving Average Convergence Divergence (MACD): Currently showing a bullish crossover, suggesting potential upward momentum.
Average Directional Index (ADX): At approximately 22.69, with a Positive Directional Indicator (PDI) at 27.41 and a Negative Directional Indicator (MDI) at 14.54, indicating a mild bullish trend.
📊 Support and Resistance Levels
Immediate Support: ₹13,208.20
Immediate Resistance: ₹13,266.05
A breakout above the resistance level could signal a continuation of the upward trend, while a dip below support may indicate a potential reversal.
📌 Investment Options
Investors interested in gaining exposure to the Nifty Midcap Select Index can consider the following options:
Exchange-Traded Funds (ETFs): These funds replicate the performance of the index and can be traded on the stock exchange.
Index Funds: Mutual funds that aim to mirror the index's performance.
Futures & Options: Derivative contracts based on the index, suitable for more experienced investors.
Direct Stock Investment: Investing in the constituent stocks of the index in the same proportion as the index.
I built a Buy & Sell Signal Indicator with 85% accuracy.
📈 Get access via DM or
WhatsApp: wa.link/d997q0
Contact - +91 76782 40962
| Email: techncialexpress@gmail.com
| Script Coder | Trader | Investor | From India
📈 Get access via DM or
WhatsApp: wa.link/d997q0
Contact - +91 76782 40962
| Email: techncialexpress@gmail.com
| Script Coder | Trader | Investor | From India
Похожие публикации
Отказ от ответственности
Информация и публикации не предназначены для предоставления и не являются финансовыми, инвестиционными, торговыми или другими видами советов или рекомендаций, предоставленных или одобренных TradingView. Подробнее читайте в Условиях использования.