[/b1. Overall Trend
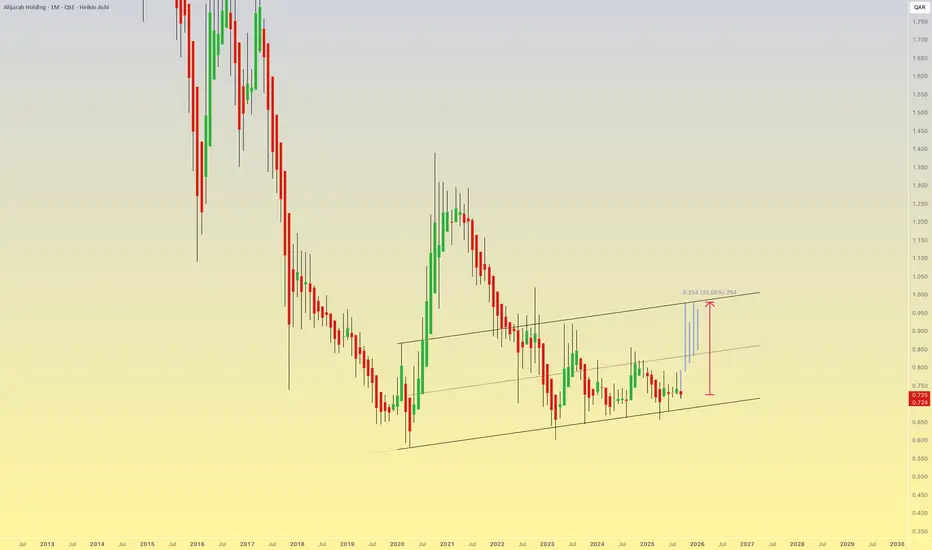
Since 2014, the stock has been in a long-term downtrend.
However, from around 2019 it started moving within an upward price channel (support and resistance trendlines).
2. Current Setup
Current price: QAR 0.724 (as of mid-September 2025).
The chart shows a clear ascending channel from 2019 onwards.
The stock is now approaching the upper boundary of the channel around 0.95–1.00 QAR.
Projection on the chart suggests ~35% potential upside if price moves toward the top of the channel.
3. Key Levels
Major Support: 0.65 – 0.68 QAR (lower channel boundary).
First Resistance: 0.85 QAR.
Second Resistance: 0.95 – 1.00 QAR (upper channel).
Breakout above 1.00 QAR could open the way toward 1.20 – 1.30 QAR, but that would require strong volume.
4. Technical Reading
Short- to medium-term bias: Positive, as long as price holds above 0.70 QAR.
Long-term bias: Still weak/neutral unless price breaks and sustains above 1.00 QAR.
The sideways movement inside the channel offers swing trading opportunities between support and resistance.
Отказ от ответственности
Все виды контента, которые вы можете увидеть на TradingView, не являются финансовыми, инвестиционными, торговыми или любыми другими рекомендациями. Мы не предоставляем советы по покупке и продаже активов. Подробнее — в Условиях использования TradingView.
Отказ от ответственности
Все виды контента, которые вы можете увидеть на TradingView, не являются финансовыми, инвестиционными, торговыми или любыми другими рекомендациями. Мы не предоставляем советы по покупке и продаже активов. Подробнее — в Условиях использования TradingView.