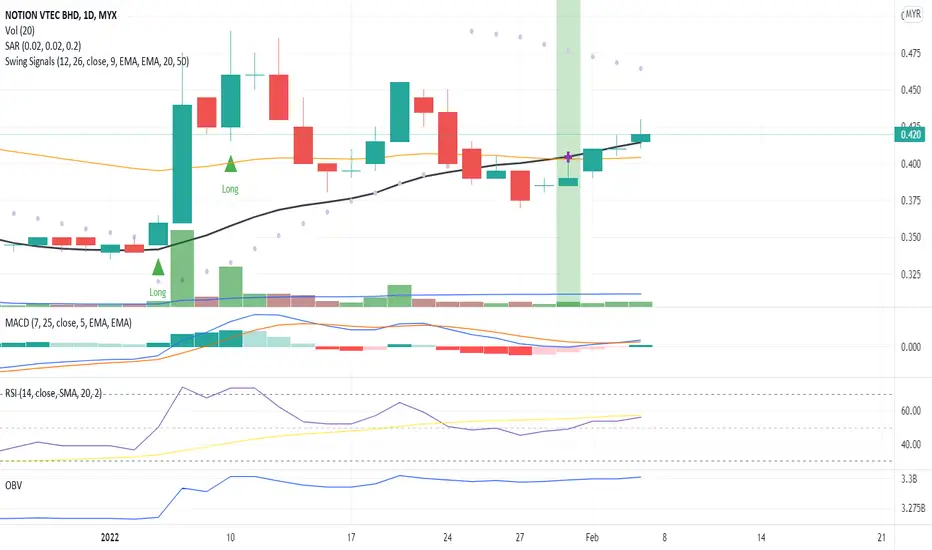
The candlestick body trend indicates an uptrend pattern where it closed above the MA20 line with volume below MA20.
The RSI is above 50 indicating a long-term uptrend momentum.
MACD and OBV indicate a divergence pattern, a beginning of an uptrend pattern.
Let's save NOTION to WL and watch out for significate price movement with volume where it continues the price momentum towards the next price resistance.
R 0.435
S 0.405
Отказ от ответственности
Информация и публикации не предназначены для предоставления и не являются финансовыми, инвестиционными, торговыми или другими видами советов или рекомендаций, предоставленных или одобренных TradingView. Подробнее читайте в Условиях использования.
Отказ от ответственности
Информация и публикации не предназначены для предоставления и не являются финансовыми, инвестиционными, торговыми или другими видами советов или рекомендаций, предоставленных или одобренных TradingView. Подробнее читайте в Условиях использования.
