This is the most basic chart I will ever draw to indicate how simple the all-important concept of supply and demand could be.
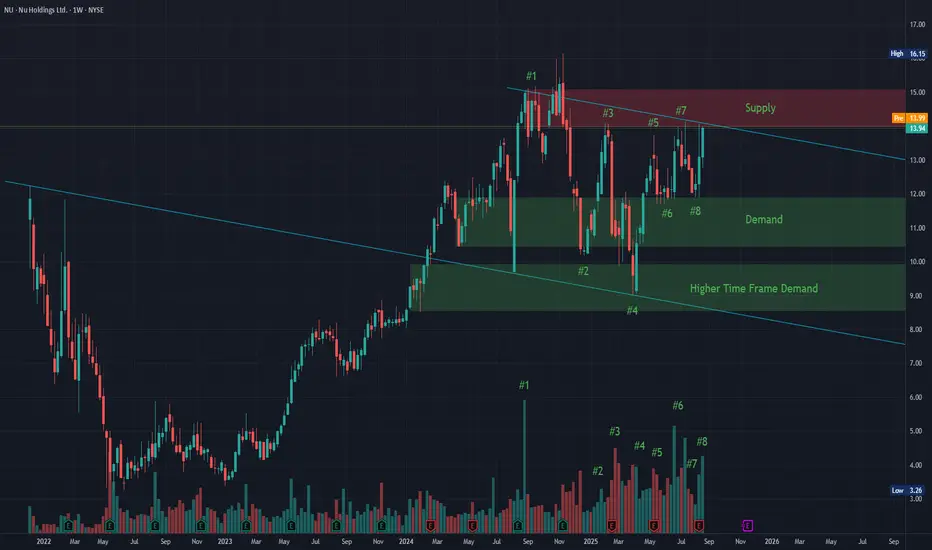
Let's begin with the initial move to all time highs that we saw in September 2024.
#1.
Strong bullish volume followed by relatively strong bearish volume.
#2.
We re-entered our recent demand zone and quickly moved to our recently created supply zone - but, with weak volume
#3.
We rejected our supply zone with strong volume leading us to needing a deeper pullback into even higher time frame demand
#4.
We utilized this higher time frame liquidity (buyers) to propel us out of the mid demand zone and right back to our supply zone
#5.
We rejected our supply zone again but this time with a less strong reaction and low volume.
#6.
Demand strengthened at our mid demand zone (indicating buyers are stepping up at higher levels). There was no need to go back to our higher time frame demand - buyers were present and indicating that fair value was higher than previously.
#7.
We retested our supply zone and although we saw a rejection, we can see that the volume was weakened and sellers were starting to fizzle out.
#8.
From our mid demand zone, we see volume spike - indicating again that buyers are extremely present but at a higher agreed-upon price.
We are now in the process of breaking through this now-weakened supply zone in order to turn all these former sellers into buyers. What was previously strong resistance will instinctively turn into strong support once the agreed-upon fair-value-price turns from $13 into $15. From there we can start to create a new base of supply and demand in the previously tapped $17-$20 range.
Happy Trading all :)
Trade the Story
Отказ от ответственности
Информация и публикации не предназначены для предоставления и не являются финансовыми, инвестиционными, торговыми или другими видами советов или рекомендаций, предоставленных или одобренных TradingView. Подробнее читайте в Условиях использования.
Trade the Story
Отказ от ответственности
Информация и публикации не предназначены для предоставления и не являются финансовыми, инвестиционными, торговыми или другими видами советов или рекомендаций, предоставленных или одобренных TradingView. Подробнее читайте в Условиях использования.