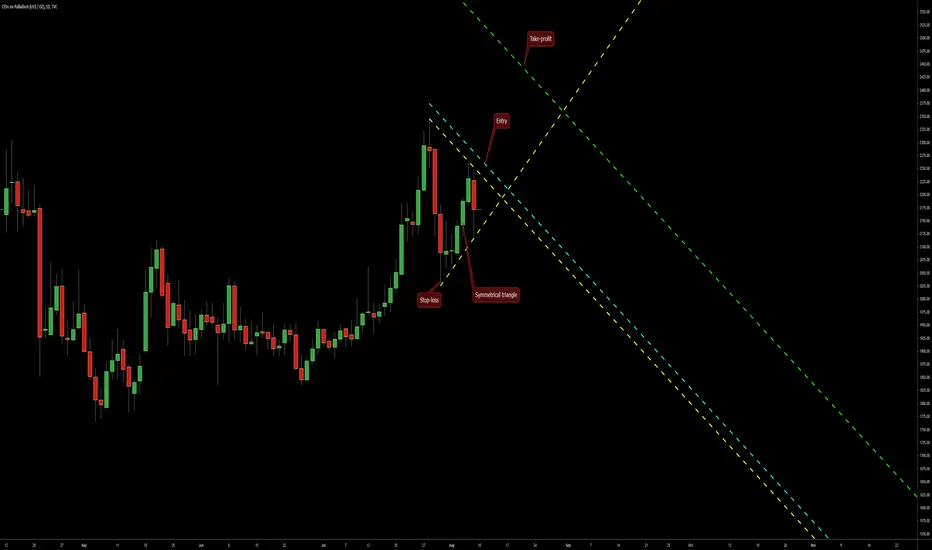
A symmetrical triangle formed on the daily chart of Palladium and now offers an opportunity to trade a bullish breakout setup. The triangle's borders are marked with the yellow lines. The potential entry level is shown with the cyan line. The potential take-profit level is where the green line is. Stop-loss can be set to the low of the triangle's base - at 2024.84.
Отказ от ответственности
Все виды контента, которые вы можете увидеть на TradingView, не являются финансовыми, инвестиционными, торговыми или любыми другими рекомендациями. Мы не предоставляем советы по покупке и продаже активов. Подробнее — в Условиях использования TradingView.
Отказ от ответственности
Все виды контента, которые вы можете увидеть на TradingView, не являются финансовыми, инвестиционными, торговыми или любыми другими рекомендациями. Мы не предоставляем советы по покупке и продаже активов. Подробнее — в Условиях использования TradingView.