📊 TECHNICAL INDICATOR ANALYSIS – PNB BEARISH OUTLOOK
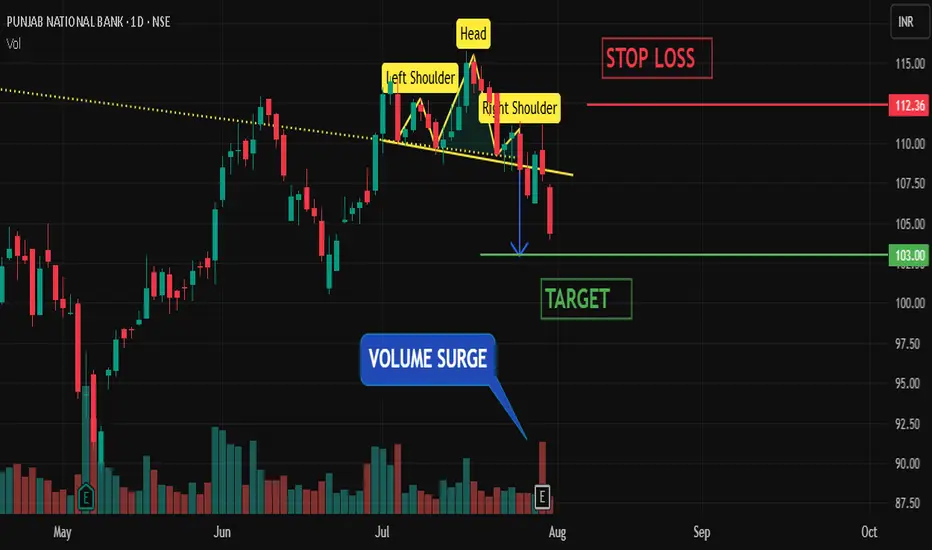
🔻 1. HEAD & SHOULDERS PATTERN FORMATION
PNB has formed a CLASSIC HEAD AND SHOULDERS PATTERN, a strong bearish reversal signal. The breakdown below the neckline confirms the end of the previous uptrend and suggests a shift in sentiment toward the downside.
📉 2. VOLUME SURGE ON BREAKDOWN :
A SIGNIFICANT SPIKE IN VOLUME was observed during the breakdown, reinforcing the bearish pattern. Volume confirmation is crucial, and in this case, it shows that sellers are aggressively stepping in to drive the price lower.
📉 3. BEARISH MACD CROSSOVER :

The MACD LINE HAS CROSSED BELOW THE SIGNAL LINE, a key momentum-based sell signal. This bearish crossover aligns with the breakdown and volume, indicating that downside momentum is likely to accelerate.
🎯 TRADE SETUP :
✅ TARGET: ₹103
❌ STOP LOSS: ₹112.5
🔻 1. HEAD & SHOULDERS PATTERN FORMATION
PNB has formed a CLASSIC HEAD AND SHOULDERS PATTERN, a strong bearish reversal signal. The breakdown below the neckline confirms the end of the previous uptrend and suggests a shift in sentiment toward the downside.
📉 2. VOLUME SURGE ON BREAKDOWN :
A SIGNIFICANT SPIKE IN VOLUME was observed during the breakdown, reinforcing the bearish pattern. Volume confirmation is crucial, and in this case, it shows that sellers are aggressively stepping in to drive the price lower.
📉 3. BEARISH MACD CROSSOVER :
The MACD LINE HAS CROSSED BELOW THE SIGNAL LINE, a key momentum-based sell signal. This bearish crossover aligns with the breakdown and volume, indicating that downside momentum is likely to accelerate.
🎯 TRADE SETUP :
✅ TARGET: ₹103
❌ STOP LOSS: ₹112.5
Сделка закрыта: достигнута тейк-профит цена
pnb has hit the desired target successfullyMy Social Media links :
📥 Instagram - instagram.com/sagar_trademaster/
📥 Youtube - youtube.com/@TruthfulTrader
📥 Instagram - instagram.com/sagar_trademaster/
📥 Youtube - youtube.com/@TruthfulTrader
Отказ от ответственности
Информация и публикации не предназначены для предоставления и не являются финансовыми, инвестиционными, торговыми или другими видами советов или рекомендаций, предоставленных или одобренных TradingView. Подробнее читайте в Условиях использования.
My Social Media links :
📥 Instagram - instagram.com/sagar_trademaster/
📥 Youtube - youtube.com/@TruthfulTrader
📥 Instagram - instagram.com/sagar_trademaster/
📥 Youtube - youtube.com/@TruthfulTrader
Отказ от ответственности
Информация и публикации не предназначены для предоставления и не являются финансовыми, инвестиционными, торговыми или другими видами советов или рекомендаций, предоставленных или одобренных TradingView. Подробнее читайте в Условиях использования.