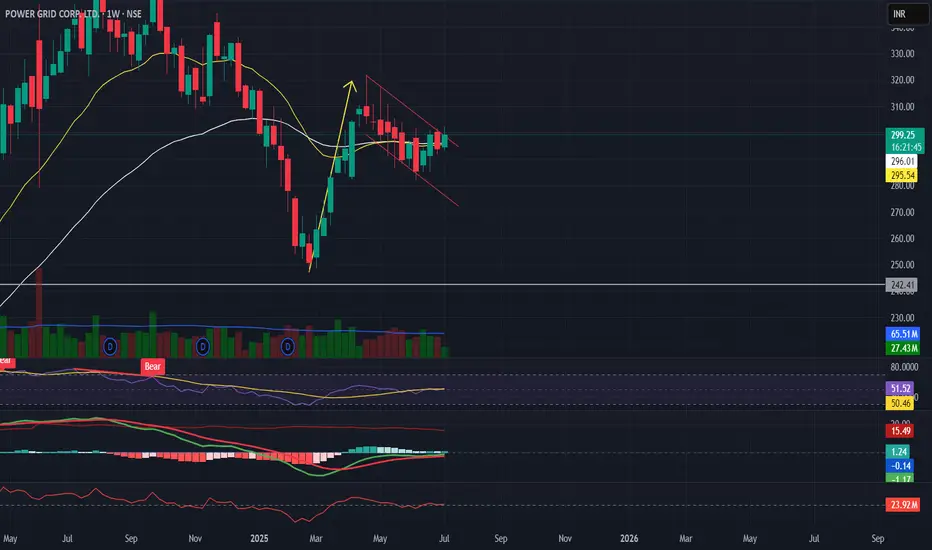
Power Grid – Breakout Plan
Watching for a clean move above ₹300 level.
Hourly chart shows Cup & Handle formation, while Daily/Weekly has Flag pattern attempting breakout.
✅ Breakout level: ₹300 (confirmation close needed)
✅ Stop-loss: ₹290–294 (below support / ATR-based)
✅ Target 1: ₹328 (Fibonacci 0.618 – Golden Ratio)
✅ Target 2: ₹375 (Measured Move)
Indicators:
EMAs rising on hourly, steady on daily.
RSI strong but nearing overbought on lower timeframe.
MACD positive momentum.
Watching volume for confirmation.
Macro Drivers:
Government infra spending.
Cooling inflation.
Rising electricity demand in India.
✅ Plan: Wait for confirmed breakout with volume. Strict risk management with pre-defined stop.
Отказ от ответственности
Информация и публикации не предназначены для предоставления и не являются финансовыми, инвестиционными, торговыми или другими видами советов или рекомендаций, предоставленных или одобренных TradingView. Подробнее читайте в Условиях использования.
Отказ от ответственности
Информация и публикации не предназначены для предоставления и не являются финансовыми, инвестиционными, торговыми или другими видами советов или рекомендаций, предоставленных или одобренных TradingView. Подробнее читайте в Условиях использования.