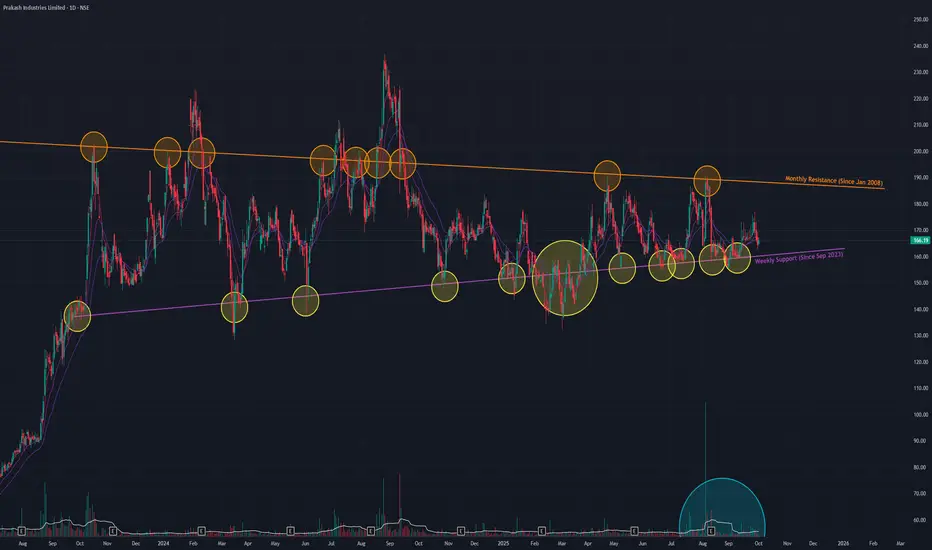
Prakash Industries is currently in a prolonged consolidation phase, trading within a large Triangle pattern that has been forming since September 2023. This pattern typically acts as a continuation of the prior trend, which in this case was a strong uptrend that began in April 2023.
The stock is now approaching the apex of this triangle, suggesting a significant price move could be imminent. The key boundaries to watch are:
- A formidable long-term resistance trendline dating back to January 2008. This level has triggered several "fake breakouts" in the past.
- A strong support trendline established since September 2023.
Outlook: A Breakout Awaits Confirmation
The stock is likely to remain range-bound in the immediate short term. A decisive move will only occur upon a breakout or breakdown from the existing pattern, which must be confirmed by a significant increase in trading volume.
- Trading Range: Within the current pattern, the stock could oscillate between the upper resistance near ₹187 and the lower support level around ₹160.
- Breakout Scenario 📈: A sustained breakout above the multi-year resistance on high volume would signal a continuation of the primary uptrend.
- Breakdown Scenario 📉: Conversely, a breakdown below the support trendline would invalidate the bullish continuation thesis and could lead to a significant correction.
Disclaimer: This analysis is my personal view & for educational purposes only. They shall not be construed as trade or investment advice. Before making any financial decision, it is imperative that you consult with a qualified financial professional.
Отказ от ответственности
Информация и публикации не предназначены для предоставления и не являются финансовыми, инвестиционными, торговыми или другими видами советов или рекомендаций, предоставленных или одобренных TradingView. Подробнее читайте в Условиях использования.