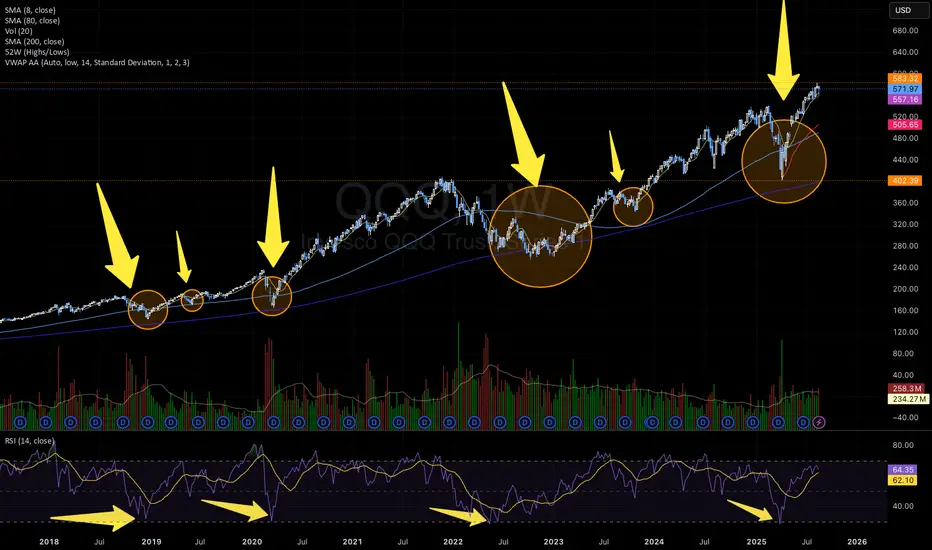
On the QQQ weekly chart, a recurring bullish pattern has emerged multiple times over the last years:
1) V-shape recoveries followed by Cup & Handle formations and then a shakeout, all of which preceded powerful upside moves (highlighted with arrows and circles).
2) Each time the weekly RSI touched the 30 zone, it triggered a strong bullish rally. This happened three times in the past (2018, 2020, 2022) and just occurred again in March/April 2025.
3) Both times the Cup & Handle pattern formed, the RSI found support around the 45 level.
This suggests that QQQ may be setting up for another bullish leg if history repeats itself.
📊 Key Takeaways:
⚠️ Not financial advice — purely a technical pattern study.
1) V-shape recoveries followed by Cup & Handle formations and then a shakeout, all of which preceded powerful upside moves (highlighted with arrows and circles).
2) Each time the weekly RSI touched the 30 zone, it triggered a strong bullish rally. This happened three times in the past (2018, 2020, 2022) and just occurred again in March/April 2025.
3) Both times the Cup & Handle pattern formed, the RSI found support around the 45 level.
This suggests that QQQ may be setting up for another bullish leg if history repeats itself.
📊 Key Takeaways:
- Weekly RSI bouncing from oversold (30 zone)
- Recurrent V-Shape + Cup & Handle + Shakeout bullish pattern
- Strong rallies historically followed this setup
⚠️ Not financial advice — purely a technical pattern study.
Отказ от ответственности
Информация и публикации не предназначены для предоставления и не являются финансовыми, инвестиционными, торговыми или другими видами советов или рекомендаций, предоставленных или одобренных TradingView. Подробнее читайте в Условиях использования.
Отказ от ответственности
Информация и публикации не предназначены для предоставления и не являются финансовыми, инвестиционными, торговыми или другими видами советов или рекомендаций, предоставленных или одобренных TradingView. Подробнее читайте в Условиях использования.