This is a post version of the analysis video I posted about QXO last night - highly recommend watching that over this. But for those who don't watch videos (you're missing out because that's where you will start to really understand the algorithms of every chart), here's a simplified version.
I’ve talked before about the fundamentals here and the broader business potential. The analyst coverage is strong - 12 Buy ratings (100% Buy) with an average price target of $32 (range: $27 to $50). And there’s plenty of great content online if you want to go deeper - interviews and podcasts featuring Brad and the leadership team.
Operationally, they're executing extremely well. Their first major acquisition - Beacon Roofing Supply - is performing, and the company has stated very clearly that they expect to make multiple more acquisitions over the next few years. Their long-term goal? To build this into a $50B revenue business within the decade. Ambitious, yes. But realistic if you know Brad’s track record.
But you probably already know that part. You're here for the technical analysis.
So let’s talk about the story of this chart.
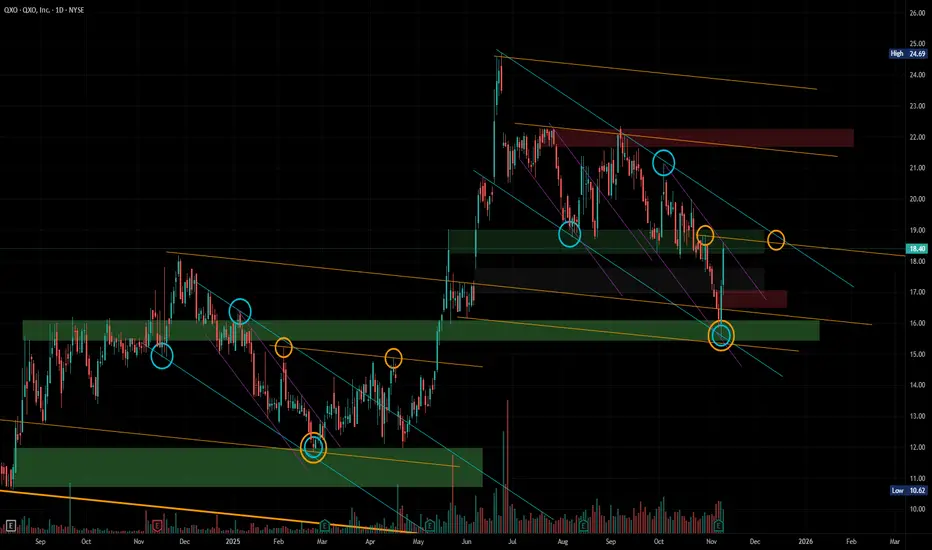
The video I posted yesterday walks through this in detail, but the key takeaway is this: we’re currently seeing the exact same liquidity build that formed during the previous breakout from $12 → $24. The same behavior. The same algorithmic demand building. The same storytelling structure in price.
As you see, the bullish nature of this chart is to prove the orange tapered selling algorithm. This is a bullish liquidity building algorithm that leads to further upside breakouts. Our goal is to disprove stronger selling teal buy proving orange. When we do this at a HTF demand/liquidity zone (like we just tapped into), we are given a powerful confirmation of bullish intent. All that's left is to prove the sell-side (top) of the orange algorithm in order to subsequently breakout. See the exact process happen previously in early 2025 - It is a mirror image to what we are seeing happen now.
This is where trading gets interesting - because if we are able to tell the chart's story and structure our plan across short-term, mid-term, and long-term targets, we give ourselves a real edge.
Hope you enjoy the breakdown!
Happy Trading :)
I’ve talked before about the fundamentals here and the broader business potential. The analyst coverage is strong - 12 Buy ratings (100% Buy) with an average price target of $32 (range: $27 to $50). And there’s plenty of great content online if you want to go deeper - interviews and podcasts featuring Brad and the leadership team.
Operationally, they're executing extremely well. Their first major acquisition - Beacon Roofing Supply - is performing, and the company has stated very clearly that they expect to make multiple more acquisitions over the next few years. Their long-term goal? To build this into a $50B revenue business within the decade. Ambitious, yes. But realistic if you know Brad’s track record.
But you probably already know that part. You're here for the technical analysis.
So let’s talk about the story of this chart.
The video I posted yesterday walks through this in detail, but the key takeaway is this: we’re currently seeing the exact same liquidity build that formed during the previous breakout from $12 → $24. The same behavior. The same algorithmic demand building. The same storytelling structure in price.
As you see, the bullish nature of this chart is to prove the orange tapered selling algorithm. This is a bullish liquidity building algorithm that leads to further upside breakouts. Our goal is to disprove stronger selling teal buy proving orange. When we do this at a HTF demand/liquidity zone (like we just tapped into), we are given a powerful confirmation of bullish intent. All that's left is to prove the sell-side (top) of the orange algorithm in order to subsequently breakout. See the exact process happen previously in early 2025 - It is a mirror image to what we are seeing happen now.
This is where trading gets interesting - because if we are able to tell the chart's story and structure our plan across short-term, mid-term, and long-term targets, we give ourselves a real edge.
Hope you enjoy the breakdown!
Happy Trading :)
Trade the Story
Похожие публикации
Отказ от ответственности
Информация и публикации не предназначены для предоставления и не являются финансовыми, инвестиционными, торговыми или другими видами советов или рекомендаций, предоставленных или одобренных TradingView. Подробнее читайте в Условиях использования.