https://www.tradingview.com/x/xVJOxxVJ
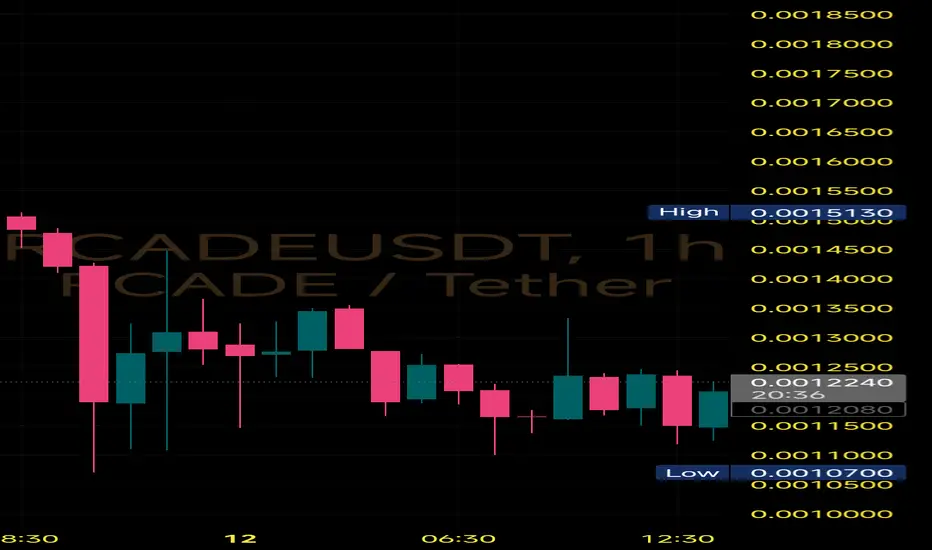
#RCADE is showing signs of a potential reversal on the 1Hr timeframe, forming a Double Bottom near the 0.00117 support zone.
🔹Bottom 1 and Bottom 2 are now clearly defined
🔹Neckline resistance at ~0.00145
🔹Current price hovering around 0.00122
Bullish only if -
A breakout and close above 0.00145 with volume = confirmation of reversal
Target zone = 0.00160–0.00170
Breakdown below 0.00117 would invalidate the double bottom setup
⏳ Price is compressing—watch for breakout attempts soon.
Отказ от ответственности
Все виды контента, которые вы можете увидеть на TradingView, не являются финансовыми, инвестиционными, торговыми или любыми другими рекомендациями. Мы не предоставляем советы по покупке и продаже активов. Подробнее — в Условиях использования TradingView.
Отказ от ответственности
Все виды контента, которые вы можете увидеть на TradingView, не являются финансовыми, инвестиционными, торговыми или любыми другими рекомендациями. Мы не предоставляем советы по покупке и продаже активов. Подробнее — в Условиях использования TradingView.