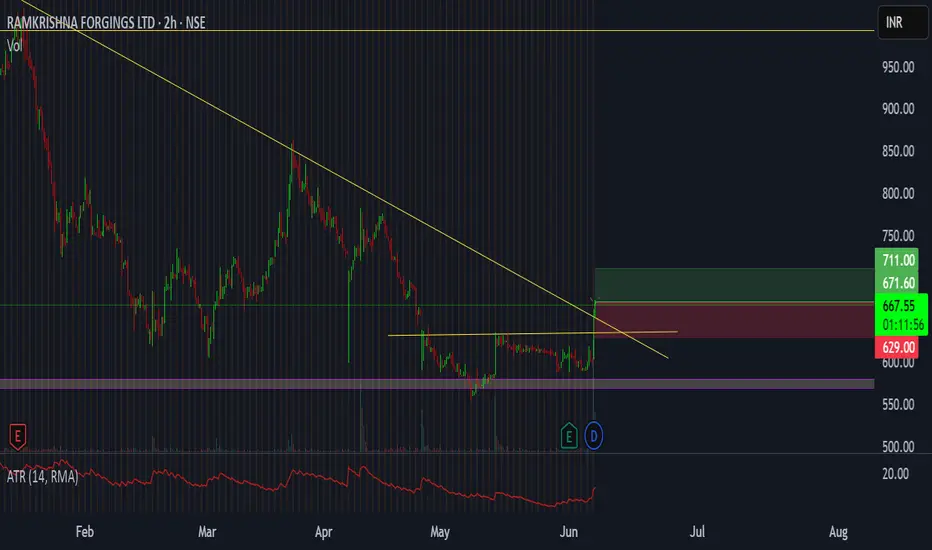
The area around 575 is a strong support on daily and weekly chart (long term support),
In the last four months, the stock has bounced off from around this level with a rise in volume,
every time higher than the previous,
A triangular pattern is also visible , having formed during this period, and now a small rectangular pattern is also visible,
A breakout through all of these has occurred today
Thus, for a short term trade,
tgt 711, sl 629
Сделка закрыта: достигнута стоп-лосс цена
Отказ от ответственности
Все виды контента, которые вы можете увидеть на TradingView, не являются финансовыми, инвестиционными, торговыми или любыми другими рекомендациями. Мы не предоставляем советы по покупке и продаже активов. Подробнее — в Условиях использования TradingView.
Отказ от ответственности
Все виды контента, которые вы можете увидеть на TradingView, не являются финансовыми, инвестиционными, торговыми или любыми другими рекомендациями. Мы не предоставляем советы по покупке и продаже активов. Подробнее — в Условиях использования TradingView.