From IPO Highs to back to IPO Base: Can Rolex Rings Break the Downtrend After 64% Crash?
After Promoter Buying and Decent Mangment Commentary Post Q2 FY26 Amid US Tariff, Let's Decode in This Week's "Chart of the Week"
As per the Latest SEBI Mandate, this isn't a Trading/Investment RECOMMENDATION nor for Educational Purposes; it is just for Informational purposes only. The chart data used is 3 Months old, as Showing Live Chart Data is not allowed according to the New SEBI Mandate.
Disclaimer: "I am not a SEBI REGISTERED RESEARCH ANALYST AND INVESTMENT ADVISER."
This analysis is intended solely for informational purposes and should not be interpreted as financial advice. It is advisable to consult a qualified financial advisor or conduct thorough research before making investment decisions.
Price Action:
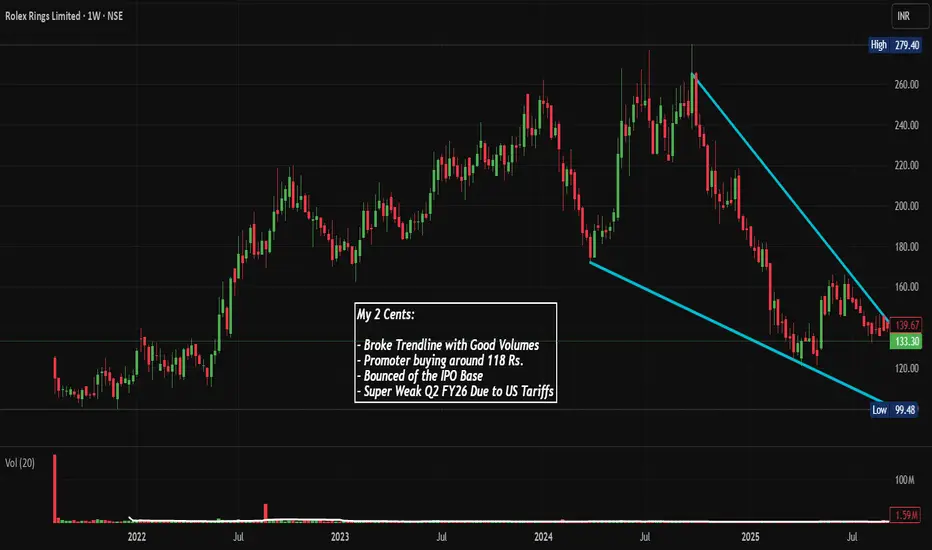
- The stock has witnessed a severe downtrend from its peak of approximately ₹280 in mid-2024 to a low of ₹99.48, representing a decline of approximately 64% from peak levels
- The chart displays a classic bearish trend characterized by lower highs and lower lows throughout 2024 and into 2025
- Price action shows the stock trading near its 52-week lows, with current price around ₹111 after bouncing from the ₹99.48 IPO Base
Trendline Analysis:
- A descending trendline has been drawn connecting the highs from mid-2024 through late 2025
- This trendline has acted as strong dynamic resistance, rejecting price advances multiple times
- The trendline currently extends downward toward the ₹100-110 zone, suggesting continued bearish momentum unless broken decisively
- The stock broke this trendline with good volumes recently, as evidenced by the spike in volume to 76.29M from an average of 6.23M.
Volume Spread Analysis:
- Average volume: 6.23M shares
- Recent surge: 76.29M shares (more than 12x average)
- Volume spike coincides with the trendline breakout attempt and bounce from lows
- This extraordinary volume surge suggests significant institutional or promoter buying interest
- Volume pattern shows accumulation at lower levels, which is a positive sign
- Higher volumes during bounce from support indicate strong conviction in buyers
Base Formation & Support Levels:
Key Support Zones:
- Primary Support (IPO Base): ₹98-120 zone - This was the IPO issue price and has historical significance as a psychological support level
- Immediate Support: ₹99.48 - The recent low established, which acted as a strong bounce point
- Secondary Support: ₹100 - Round number psychological support
- A potential base formation is emerging in the ₹99-120 range after months of decline
Resistance Levels:
- Immediate Resistance: ₹130-140 zone (previous support turned resistance)
- Intermediate Resistance: ₹160-170 (multiple rejections in this zone during the downtrend)
- Major Resistance: ₹180-200 zone (previous consolidation area)
- The descending trendline acts as dynamic resistance currently around ₹150-160
- Ultimate Resistance: ₹240-280 zone (peak highs from 2024)
Technical Patterns:
Descending Channel:
- The stock has been trading within a well-defined descending channel since mid-2024
- Lower boundary of channel approximately at ₹100, upper boundary following the drawn trendline
- Recent price action suggests potential channel breakout attempt
Double Bottom Formation (Potential):
- The chart shows a potential double bottom pattern forming around the ₹100 level
- First bottom at ₹99.48 (recent low)
- Second bottom would need to be confirmed near similar levels with higher low
- Neckline resistance would be around ₹140-150 zone
- This pattern, if confirmed, could signal trend reversal
Falling Wedge (Forming):
- The narrowing range between descending trendline and support suggests a falling wedge pattern
- Falling wedges are typically bullish reversal patterns
- Breakout above the trendline with volume could trigger significant upside
My Key Technical Observations:
- The stock has been in a sustained downtrend for approximately 18 months
- Recent price action shows signs of exhaustion at lower levels
- Trendline break with massive volume is a significant development
- The stock is oversold and due for a technical bounce
- Risk-reward ratio favors long positions from current levels with stop loss below ₹99
My Technical Outlook:
Bullish Case:
- Trendline breakout with exceptional volume
- Support holding at IPO base (₹118) and recent low (₹99.48)
- Potential reversal patterns forming
- Oversold conditions on longer timeframes
- Smart money accumulation evident from volume analysis
Bearish Case:
- Long-term downtrend still intact until sustained breakout
- Multiple resistance levels overhead
- Weak fundamental performance in recent quarters
- Sectoral headwinds persist
Sectoral and Fundamental Backdrop:
Company Overview:
 ROLEXRINGS , headquartered in Rajkot, Gujarat, is among India's leading manufacturers of forged and machined bearing rings and automotive components in the private sector. The company boasts a forging capacity of 144,750 metric tons per annum (MTPA) and an annual machining capacity of 73 million pieces. It serves clients across India and 15 international markets spanning North America, Europe, and Africa.
Product Portfolio:
- Bearing Rings (approximately 45-47% of revenue): Ball bearing rings, cylindrical, tapered, and spherical types for automotive, railways, industrial, and wind turbine applications
- Automotive Components (approximately 53-55% of revenue): Transmission components (gear blanks, ring gears, sun and pinion, shafts), engine components (pulleys, cam lobes), chassis components (wheel hubs, Gen2 and Gen3 bearing components, output shafts, CVJ components), and exhaust system components
Sector Analysis: Auto Components Industry:
Industry Challenges (2025):
The auto components sector has faced significant headwinds through 2025, with demand moderation across passenger vehicles, commercial vehicles, and two-wheelers impacting component manufacturers. The sector is experiencing increased competitive intensity, with OEMs exerting pressure on suppliers to reduce costs while simultaneously demanding higher quality standards and faster delivery cycles.
Growth Drivers:
- Domestic automobile demand remains relatively robust
- Electric vehicle (EV) and hybrid segment growth (company derives 8% of FY25 revenue from this segment)
- China+1 strategy benefiting Indian manufacturers
- Localization push by global OEMs
Financial Performance Analysis:
Recent Performance (Q2 FY26):
Rolex Rings reported net sales of ₹271.38 crores in Q2 FY26, marking a 6.93% sequential decline from ₹291.58 crores in Q1 FY26 and a 9.62% year-on-year drop from ₹300.27 crores in Q2 FY25. Net profit declined 9.94% quarter-on-quarter to ₹44.34 crores from ₹49.16 crores in Q1 FY26.
Margin Pressure:
Operating margins (excluding other income) have declined from a peak of 22.89% in June 2024 to 20.21% in September 2025, a contraction of 268 basis points over five quarters. This margin compression reflects pricing pressures and unfavorable product mix shifts.
Profitability Metrics:
- PE Ratio: 19.97
- PB Ratio: 3.24
- ROE: 17.48% (latest quarter, down from historical average of 22.12%)
- ROCE: 26.44%
Key Fundamental Challenges:
US Tariff Impact:
While the company had previously guided for 14-16% top-line growth for FY26, management has now moderated this to "early teen growth" if US tariffs persist, with higher growth expected in FY27. The company notes that US customer-related volumes have slowed considerably until there is clarity on the final trade deal. However, there's a 25% US custom duty waiver in major portion of exports to US, effective from November 1, 2025.
Export-Domestic Mix:
- Exports: 51-52% of revenue
- Domestic: 48-49% of revenue
- Bearing rings export business facing subdued global demand, particularly in industrial segment
- Auto components export business showing resilience, especially in Europe and Mexico
Positive Developments:
Strong Order Book:
The company has Rs 1.75 billion of order inflows expected to flow from Q2FY26, which can be ramped up to Rs 2.5 billion in FY27. The management expects 15% blended growth for FY26 and 10% growth guidance for FY27.
Operational Excellence:
The significant EBITDA margin expansion in Q1FY26 to 26.5%, up from 21.9% in Q4FY25, demonstrates management's strong grip on cost control and operational efficiencies. The company has successfully commissioned a 9MW solar plant (expected to be operational by December 2025), adding to existing 17.08MW capacity, which aids margin improvement.
Balance Sheet Strength:
The company has transitioned to a net cash position from previous debt levels, demonstrating strong cash management. For FY26, management has guided a much lower capital expenditure of ₹30-35 crore, which can easily be funded by internal accruals.
Strategic Positioning:
Market Position:
Rolex Rings ranks top 5 amongst 130 active competitors in the forging and machining space. The company is benefiting from the China+1 theme, receiving improved traction from the US and Europe as an alternative to Chinese suppliers.
Customer Diversification:
The company is actively diversifying its customer base and expanding into value-added products for EVs/Hybrids which require complex machining and fetch approximately 200 basis points higher margins over standard offerings.
Strengths:
- Strong domestic market presence
- Diversified product portfolio across bearing rings and auto components
- Healthy order book visibility for FY26-27
- Improved operational efficiency and margin trajectory (when excluding tariff headwinds)
- Net cash position providing financial flexibility
- Competitive positioning in forging capacity
Risks:
- Export market volatility due to global trade tensions and tariffs
- Sustained margin pressure from OEM cost reduction demands
- Subdued growth in commercial vehicle and industrial segments
- High dependence on automotive sector cyclicality
- Revenue degrowth trend in recent quarters
Valuation Perspective:
At current levels around ₹111, the stock trades significantly below its historical highs and near book value. While near-term challenges persist, the long-term structural growth story of India's automotive sector, coupled with the company's strong market position and improving operational metrics, presents a compelling risk-reward opportunity for patient investors.
Management Outlook:
The company anticipates recovery in bearing rings business by Q3-Q4 FY26 and expects full recovery in export markets to take four to six quarters. The management remains confident about achieving EBITDA margins of 23.5-24% in FY26 and over 24% in FY27, supported by improved operational leverage, product mix enhancement, and benefits from renewable energy investments.
Full Coverage on my Newsletter this Week
Keep in the Watchlist and DOYR.
NO RECO. For Buy/Sell.
📌Thank you for exploring my idea! I hope you found it valuable.
🙏FOLLOW for more
👍BOOST if you found it useful.
✍️COMMENT below with your views.
Meanwhile, check out my other stock ideas on the right side until this trade is activated. I would love your feedback.
As per the Latest SEBI Mandate, this isn't a Trading/Investment RECOMMENDATION nor for Educational Purposes; it is just for Informational purposes only. The chart data used is 3 Months old, as Showing Live Chart Data is not allowed according to the New SEBI Mandate.
Disclaimer: "I am not a SEBI REGISTERED RESEARCH ANALYST AND INVESTMENT ADVISER."
This analysis is intended solely for informational purposes and should not be interpreted as financial advice. It is advisable to consult a qualified financial advisor or conduct thorough research before making investment decisions.
After Promoter Buying and Decent Mangment Commentary Post Q2 FY26 Amid US Tariff, Let's Decode in This Week's "Chart of the Week"
As per the Latest SEBI Mandate, this isn't a Trading/Investment RECOMMENDATION nor for Educational Purposes; it is just for Informational purposes only. The chart data used is 3 Months old, as Showing Live Chart Data is not allowed according to the New SEBI Mandate.
Disclaimer: "I am not a SEBI REGISTERED RESEARCH ANALYST AND INVESTMENT ADVISER."
This analysis is intended solely for informational purposes and should not be interpreted as financial advice. It is advisable to consult a qualified financial advisor or conduct thorough research before making investment decisions.
Price Action:
- The stock has witnessed a severe downtrend from its peak of approximately ₹280 in mid-2024 to a low of ₹99.48, representing a decline of approximately 64% from peak levels
- The chart displays a classic bearish trend characterized by lower highs and lower lows throughout 2024 and into 2025
- Price action shows the stock trading near its 52-week lows, with current price around ₹111 after bouncing from the ₹99.48 IPO Base
Trendline Analysis:
- A descending trendline has been drawn connecting the highs from mid-2024 through late 2025
- This trendline has acted as strong dynamic resistance, rejecting price advances multiple times
- The trendline currently extends downward toward the ₹100-110 zone, suggesting continued bearish momentum unless broken decisively
- The stock broke this trendline with good volumes recently, as evidenced by the spike in volume to 76.29M from an average of 6.23M.
Volume Spread Analysis:
- Average volume: 6.23M shares
- Recent surge: 76.29M shares (more than 12x average)
- Volume spike coincides with the trendline breakout attempt and bounce from lows
- This extraordinary volume surge suggests significant institutional or promoter buying interest
- Volume pattern shows accumulation at lower levels, which is a positive sign
- Higher volumes during bounce from support indicate strong conviction in buyers
Base Formation & Support Levels:
Key Support Zones:
- Primary Support (IPO Base): ₹98-120 zone - This was the IPO issue price and has historical significance as a psychological support level
- Immediate Support: ₹99.48 - The recent low established, which acted as a strong bounce point
- Secondary Support: ₹100 - Round number psychological support
- A potential base formation is emerging in the ₹99-120 range after months of decline
Resistance Levels:
- Immediate Resistance: ₹130-140 zone (previous support turned resistance)
- Intermediate Resistance: ₹160-170 (multiple rejections in this zone during the downtrend)
- Major Resistance: ₹180-200 zone (previous consolidation area)
- The descending trendline acts as dynamic resistance currently around ₹150-160
- Ultimate Resistance: ₹240-280 zone (peak highs from 2024)
Technical Patterns:
Descending Channel:
- The stock has been trading within a well-defined descending channel since mid-2024
- Lower boundary of channel approximately at ₹100, upper boundary following the drawn trendline
- Recent price action suggests potential channel breakout attempt
Double Bottom Formation (Potential):
- The chart shows a potential double bottom pattern forming around the ₹100 level
- First bottom at ₹99.48 (recent low)
- Second bottom would need to be confirmed near similar levels with higher low
- Neckline resistance would be around ₹140-150 zone
- This pattern, if confirmed, could signal trend reversal
Falling Wedge (Forming):
- The narrowing range between descending trendline and support suggests a falling wedge pattern
- Falling wedges are typically bullish reversal patterns
- Breakout above the trendline with volume could trigger significant upside
My Key Technical Observations:
- The stock has been in a sustained downtrend for approximately 18 months
- Recent price action shows signs of exhaustion at lower levels
- Trendline break with massive volume is a significant development
- The stock is oversold and due for a technical bounce
- Risk-reward ratio favors long positions from current levels with stop loss below ₹99
My Technical Outlook:
Bullish Case:
- Trendline breakout with exceptional volume
- Support holding at IPO base (₹118) and recent low (₹99.48)
- Potential reversal patterns forming
- Oversold conditions on longer timeframes
- Smart money accumulation evident from volume analysis
Bearish Case:
- Long-term downtrend still intact until sustained breakout
- Multiple resistance levels overhead
- Weak fundamental performance in recent quarters
- Sectoral headwinds persist
Sectoral and Fundamental Backdrop:
Company Overview:
Product Portfolio:
- Bearing Rings (approximately 45-47% of revenue): Ball bearing rings, cylindrical, tapered, and spherical types for automotive, railways, industrial, and wind turbine applications
- Automotive Components (approximately 53-55% of revenue): Transmission components (gear blanks, ring gears, sun and pinion, shafts), engine components (pulleys, cam lobes), chassis components (wheel hubs, Gen2 and Gen3 bearing components, output shafts, CVJ components), and exhaust system components
Sector Analysis: Auto Components Industry:
Industry Challenges (2025):
The auto components sector has faced significant headwinds through 2025, with demand moderation across passenger vehicles, commercial vehicles, and two-wheelers impacting component manufacturers. The sector is experiencing increased competitive intensity, with OEMs exerting pressure on suppliers to reduce costs while simultaneously demanding higher quality standards and faster delivery cycles.
Growth Drivers:
- Domestic automobile demand remains relatively robust
- Electric vehicle (EV) and hybrid segment growth (company derives 8% of FY25 revenue from this segment)
- China+1 strategy benefiting Indian manufacturers
- Localization push by global OEMs
Financial Performance Analysis:
Recent Performance (Q2 FY26):
Rolex Rings reported net sales of ₹271.38 crores in Q2 FY26, marking a 6.93% sequential decline from ₹291.58 crores in Q1 FY26 and a 9.62% year-on-year drop from ₹300.27 crores in Q2 FY25. Net profit declined 9.94% quarter-on-quarter to ₹44.34 crores from ₹49.16 crores in Q1 FY26.
Margin Pressure:
Operating margins (excluding other income) have declined from a peak of 22.89% in June 2024 to 20.21% in September 2025, a contraction of 268 basis points over five quarters. This margin compression reflects pricing pressures and unfavorable product mix shifts.
Profitability Metrics:
- PE Ratio: 19.97
- PB Ratio: 3.24
- ROE: 17.48% (latest quarter, down from historical average of 22.12%)
- ROCE: 26.44%
Key Fundamental Challenges:
US Tariff Impact:
While the company had previously guided for 14-16% top-line growth for FY26, management has now moderated this to "early teen growth" if US tariffs persist, with higher growth expected in FY27. The company notes that US customer-related volumes have slowed considerably until there is clarity on the final trade deal. However, there's a 25% US custom duty waiver in major portion of exports to US, effective from November 1, 2025.
Export-Domestic Mix:
- Exports: 51-52% of revenue
- Domestic: 48-49% of revenue
- Bearing rings export business facing subdued global demand, particularly in industrial segment
- Auto components export business showing resilience, especially in Europe and Mexico
Positive Developments:
Strong Order Book:
The company has Rs 1.75 billion of order inflows expected to flow from Q2FY26, which can be ramped up to Rs 2.5 billion in FY27. The management expects 15% blended growth for FY26 and 10% growth guidance for FY27.
Operational Excellence:
The significant EBITDA margin expansion in Q1FY26 to 26.5%, up from 21.9% in Q4FY25, demonstrates management's strong grip on cost control and operational efficiencies. The company has successfully commissioned a 9MW solar plant (expected to be operational by December 2025), adding to existing 17.08MW capacity, which aids margin improvement.
Balance Sheet Strength:
The company has transitioned to a net cash position from previous debt levels, demonstrating strong cash management. For FY26, management has guided a much lower capital expenditure of ₹30-35 crore, which can easily be funded by internal accruals.
Strategic Positioning:
Market Position:
Rolex Rings ranks top 5 amongst 130 active competitors in the forging and machining space. The company is benefiting from the China+1 theme, receiving improved traction from the US and Europe as an alternative to Chinese suppliers.
Customer Diversification:
The company is actively diversifying its customer base and expanding into value-added products for EVs/Hybrids which require complex machining and fetch approximately 200 basis points higher margins over standard offerings.
Strengths:
- Strong domestic market presence
- Diversified product portfolio across bearing rings and auto components
- Healthy order book visibility for FY26-27
- Improved operational efficiency and margin trajectory (when excluding tariff headwinds)
- Net cash position providing financial flexibility
- Competitive positioning in forging capacity
Risks:
- Export market volatility due to global trade tensions and tariffs
- Sustained margin pressure from OEM cost reduction demands
- Subdued growth in commercial vehicle and industrial segments
- High dependence on automotive sector cyclicality
- Revenue degrowth trend in recent quarters
Valuation Perspective:
At current levels around ₹111, the stock trades significantly below its historical highs and near book value. While near-term challenges persist, the long-term structural growth story of India's automotive sector, coupled with the company's strong market position and improving operational metrics, presents a compelling risk-reward opportunity for patient investors.
Management Outlook:
The company anticipates recovery in bearing rings business by Q3-Q4 FY26 and expects full recovery in export markets to take four to six quarters. The management remains confident about achieving EBITDA margins of 23.5-24% in FY26 and over 24% in FY27, supported by improved operational leverage, product mix enhancement, and benefits from renewable energy investments.
Full Coverage on my Newsletter this Week
Keep in the Watchlist and DOYR.
NO RECO. For Buy/Sell.
📌Thank you for exploring my idea! I hope you found it valuable.
🙏FOLLOW for more
👍BOOST if you found it useful.
✍️COMMENT below with your views.
Meanwhile, check out my other stock ideas on the right side until this trade is activated. I would love your feedback.
As per the Latest SEBI Mandate, this isn't a Trading/Investment RECOMMENDATION nor for Educational Purposes; it is just for Informational purposes only. The chart data used is 3 Months old, as Showing Live Chart Data is not allowed according to the New SEBI Mandate.
Disclaimer: "I am not a SEBI REGISTERED RESEARCH ANALYST AND INVESTMENT ADVISER."
This analysis is intended solely for informational purposes and should not be interpreted as financial advice. It is advisable to consult a qualified financial advisor or conduct thorough research before making investment decisions.
Похожие публикации
Отказ от ответственности
Информация и публикации не предназначены для предоставления и не являются финансовыми, инвестиционными, торговыми или другими видами советов или рекомендаций, предоставленных или одобренных TradingView. Подробнее читайте в Условиях использования.
Похожие публикации
Отказ от ответственности
Информация и публикации не предназначены для предоставления и не являются финансовыми, инвестиционными, торговыми или другими видами советов или рекомендаций, предоставленных или одобренных TradingView. Подробнее читайте в Условиях использования.