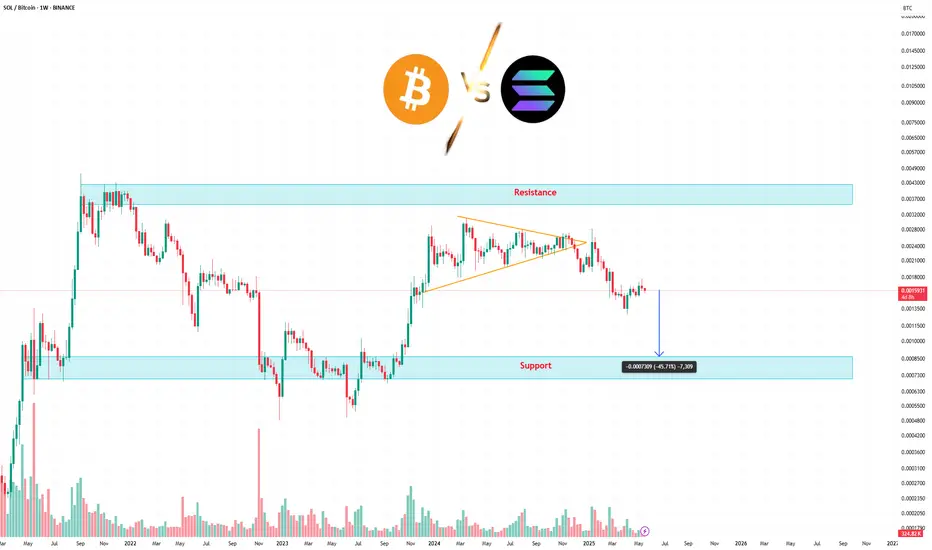
The chart shows a clear weakening of Solana against Bitcoin. After a prolonged sideways phase within a symmetrical triangle, price has broken down, signaling a potential bearish continuation.
🔻 Technical pattern:
Well-defined symmetrical triangle (orange lines) broken to the downside.
Breakdown occurred with rising volume, confirming the validity of the move.
📌 Key levels:
Resistance: 0.00370 – 0.00430 BTC (strong supply zone, repeatedly rejected).
Support: 0.00073 – 0.00110 BTC (historical potential bounce zone).
Price is currently heading toward support, with a theoretical target around 0.00110 BTC, in line with the triangle’s height.
📊 Volume:
Gradual decline during the triangle formation.
Volume spike on breakdown – a confirmation signal.
⚠️ Observations:
The SOL/BTC pair is showing clear relative weakness vs BTC.
If the highlighted support zone fails to hold, new local lows may be in sight.
Potential reversal signals would require a reclaim of resistance or evident accumulation near support.
🚀Get free signals, strategies, market insights & tools I use.
📌 Telegram Channel : t.me/cryptolvke
📌Free Crypto Strategy : bit.ly/SolStrategy
📌 Shop : beacons.ai/cryptoluke
📌 Support : t.me/CryptoLukeSupport
📌 Telegram Channel : t.me/cryptolvke
📌Free Crypto Strategy : bit.ly/SolStrategy
📌 Shop : beacons.ai/cryptoluke
📌 Support : t.me/CryptoLukeSupport
Отказ от ответственности
Информация и публикации не предназначены для предоставления и не являются финансовыми, инвестиционными, торговыми или другими видами советов или рекомендаций, предоставленных или одобренных TradingView. Подробнее читайте в Условиях использования.