## 📊 Chart Overview
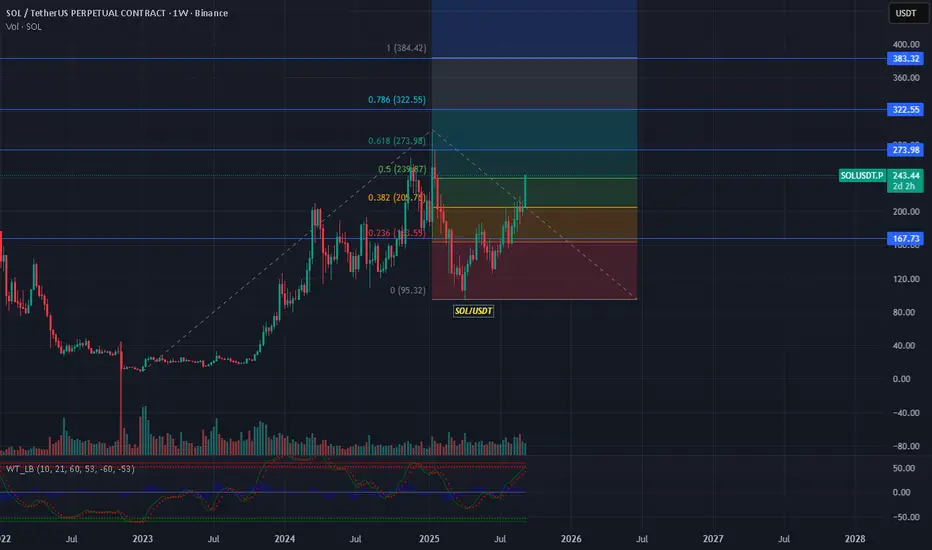
* **Pair:** SOL/USDT (Perpetual Futures, Binance)
* **Current Price:** \$243.44 (+18.01%)
* **Timeframe:** 1W (long-term trend)
* **Volume:** 147.8M (rising, signaling strong participation)
* **Indicators:** Fibonacci retracement, WaveTrend oscillator
---
## 🔑 Fibonacci Levels (swing low \$95.32 → swing high \$384.42)
* **0.236 Fib:** \$163.55 → strong support, successfully defended.
* **0.382 Fib:** \$205.87 → breakout level, now acting as support.
* **0.5 Fib:** \$239.87 → current zone, SOL is testing this level.
* **0.618 Fib:** \$273.98 → next resistance if \$240 holds.
* **0.786 Fib:** \$322.55 → heavy resistance zone.
* **1.0 Fib:** \$384.42 → previous high, potential long-term target.
---
## 📈 Price Action
* SOL has **broken above the \$205 level** and is now consolidating near **\$240**.
* The weekly breakout candle suggests **renewed bullish momentum**.
* Higher lows since the \$95 bottom show a **reversal structure** forming.
---
## 📉 Indicators
* **WaveTrend Oscillator (WT):**
* Currently moving upward, showing **bullish momentum**.
* Entering overbought territory, so short-term corrections are possible.
* **Volume:**
* A surge in weekly volume confirms **strong buying interest**.
---
## 🧭 Outlook
* **Bullish Case:**
* Sustained move above **\$240** opens targets at **\$274 → \$322 → \$384**.
* If momentum extends in a bull cycle, the Fibonacci extension could take SOL toward **\$500–\$560**.
* **Bearish Case:**
* If rejected at \$240–\$245 zone, price may retest **\$205**.
* Failure to hold \$205 could drag it back to **\$167** support.
---
## ⚠️ Risk Note
* SOL is at a **critical mid-Fib level (0.5 zone)**, which often acts as a **decision point**.
* Weekly close above \$240 will confirm strength, but if it fails, downside correction risk rises.
* Always track Bitcoin’s movement since SOL is highly correlated.
---
✅ **Summary:**
SOL is in a **bullish breakout phase**, reclaiming the \$240 zone. Holding above this level can accelerate a rally toward **\$274–\$322**, while failure may bring a pullback to **\$205–\$167**.
Отказ от ответственности
Все виды контента, которые вы можете увидеть на TradingView, не являются финансовыми, инвестиционными, торговыми или любыми другими рекомендациями. Мы не предоставляем советы по покупке и продаже активов. Подробнее — в Условиях использования TradingView.
Отказ от ответственности
Все виды контента, которые вы можете увидеть на TradingView, не являются финансовыми, инвестиционными, торговыми или любыми другими рекомендациями. Мы не предоставляем советы по покупке и продаже активов. Подробнее — в Условиях использования TradingView.