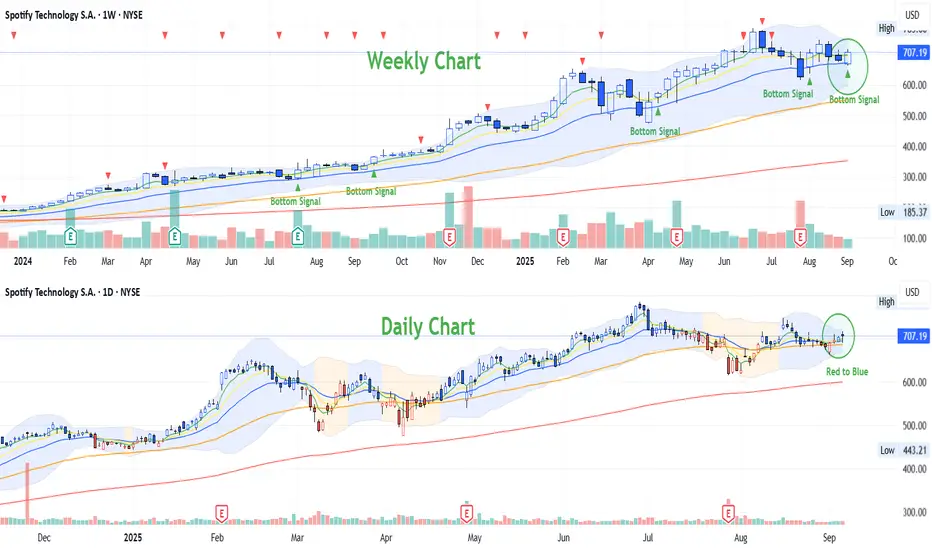
Weekly Chart: Bottom Signal is triggered on this week (week1 of September). Is this mean the consolidation will be done on September? And the long term uptrend will be continued? Based on the historical data, whenever the bottom signal was appeared, there was the beginning of the new wave..
Daily Chart: Red candlestick just turn to Blue Candlestick in Blue Zone. The system is telling us maybe this is just a beginning of another uptrend wave.
Let's monitor this long term uptrend stock from today onwards. :)
Daily Chart: Red candlestick just turn to Blue Candlestick in Blue Zone. The system is telling us maybe this is just a beginning of another uptrend wave.
Let's monitor this long term uptrend stock from today onwards. :)
Отказ от ответственности
Все виды контента, которые вы можете увидеть на TradingView, не являются финансовыми, инвестиционными, торговыми или любыми другими рекомендациями. Мы не предоставляем советы по покупке и продаже активов. Подробнее — в Условиях использования TradingView.
Отказ от ответственности
Все виды контента, которые вы можете увидеть на TradingView, не являются финансовыми, инвестиционными, торговыми или любыми другими рекомендациями. Мы не предоставляем советы по покупке и продаже активов. Подробнее — в Условиях использования TradingView.