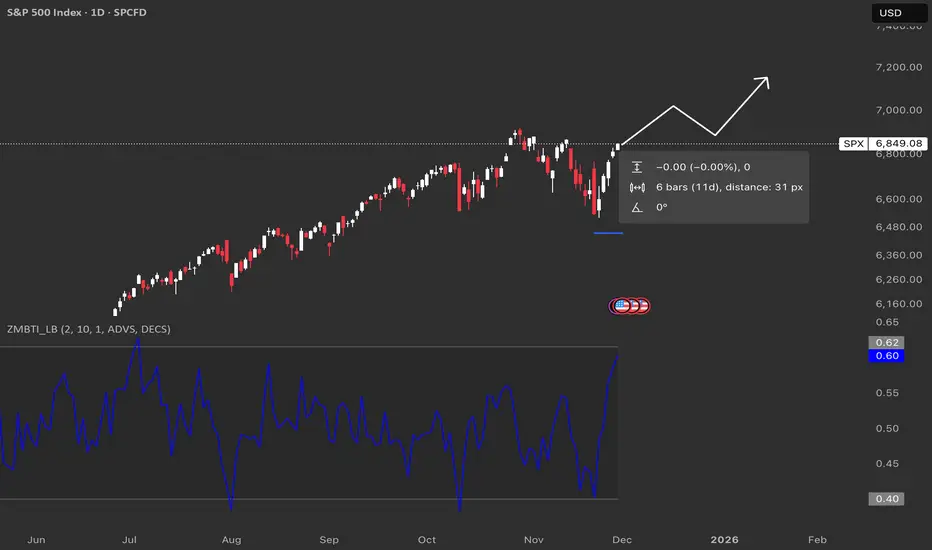
The Breadth Thrust Indicator is a technical indicator that looks at how many stocks advance vs. decline over 10 days.
When it snaps from around 0.40 to above about 0.615 in 10 trading days or less, that’s called a Zweig Breadth Thrust and has historically lined up with strong bull runs more often than not.
Historically it doesn’t happen often, but when it does, forward returns over the next several months have usually been positive, which is why traders get excited when the line on your chart surges like this.
Historically, once a full thrust has triggered, the index has often been higher 6–12 months later in the majority of cases.
Отказ от ответственности
Информация и публикации не предназначены для предоставления и не являются финансовыми, инвестиционными, торговыми или другими видами советов или рекомендаций, предоставленных или одобренных TradingView. Подробнее читайте в Условиях использования.
Отказ от ответственности
Информация и публикации не предназначены для предоставления и не являются финансовыми, инвестиционными, торговыми или другими видами советов или рекомендаций, предоставленных или одобренных TradingView. Подробнее читайте в Условиях использования.