Hello✌️
Let’s analyze SPX900’s price action both technically and fundamentally 📈.
🔍Fundamental analysis:
SPX6900 pumps when social buzz goes up, but can also drop fast if hype cools down.
📊Technical analysis:

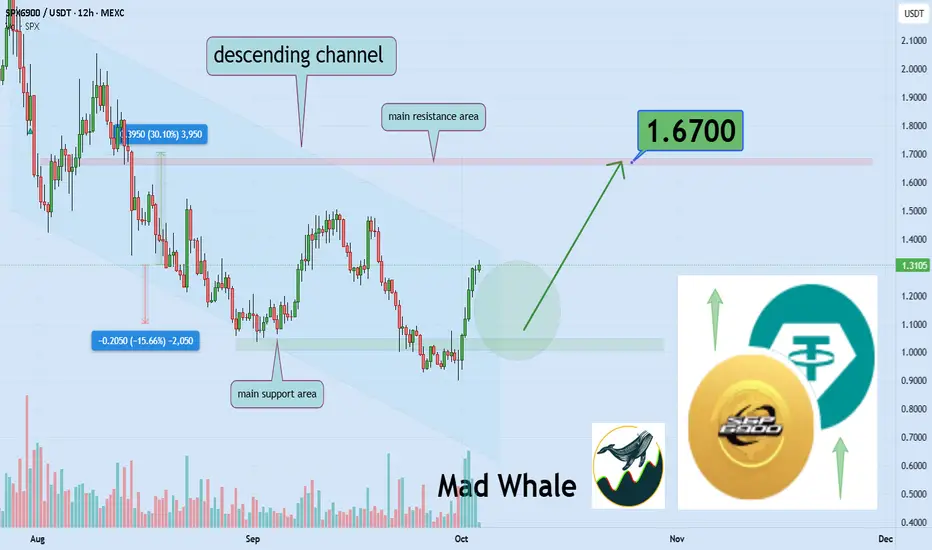
 SPXUSDT is trading within a descending channel and approaching a key support and the upper boundary. A breakout above the channel could drive a potential 30% upside toward $1.67.⚡
📈Using My Analysis to Open Your Position:
You can use my fundamental and technical insights along with the chart. The red and green arrows on the left help you set entry, take-profit, and stop-loss levels, serving as clear signals for your trades.⚡️ Also, please review the TradingView disclaimer carefully.🛡
✨We put love into every post!
Your support inspires us 💛 Drop a comment we’d love to hear from you! Thanks, Mad Whale
Let’s analyze SPX900’s price action both technically and fundamentally 📈.
🔍Fundamental analysis:
SPX6900 pumps when social buzz goes up, but can also drop fast if hype cools down.
📊Technical analysis:
📈Using My Analysis to Open Your Position:
You can use my fundamental and technical insights along with the chart. The red and green arrows on the left help you set entry, take-profit, and stop-loss levels, serving as clear signals for your trades.⚡️ Also, please review the TradingView disclaimer carefully.🛡
✨We put love into every post!
Your support inspires us 💛 Drop a comment we’d love to hear from you! Thanks, Mad Whale
Educational plans & Free signals, all in telegram:
👉t.me/madwhalechannel
👉t.me/madwhalechannel
Отказ от ответственности
Информация и публикации не предназначены для предоставления и не являются финансовыми, инвестиционными, торговыми или другими видами советов или рекомендаций, предоставленных или одобренных TradingView. Подробнее читайте в Условиях использования.