not an expert, just showing what i’m seeing on the 4H chart 👇
🧭 quick breakdown:
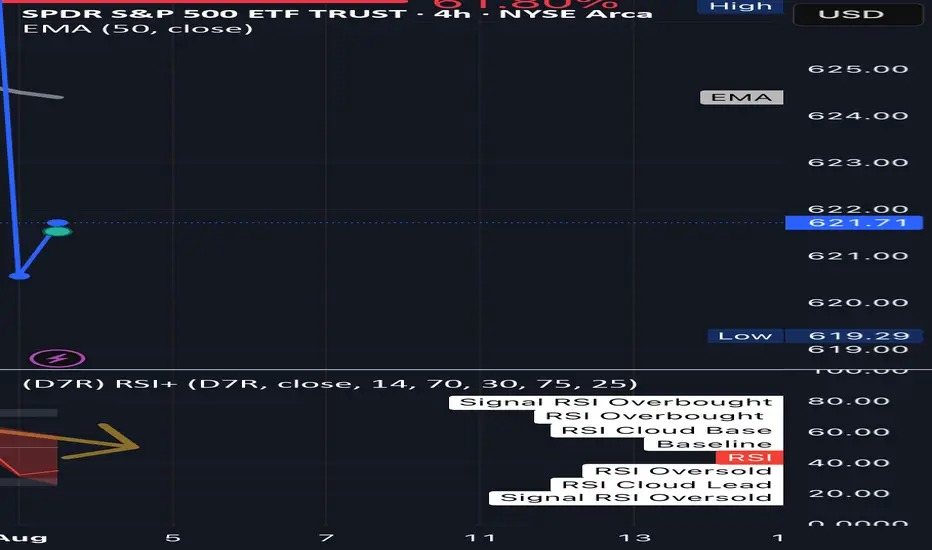
SPY ran up to around 639, then started dumping.
i dropped a fib from top to bottom and it hit the 61.8% level (626.66)… then lost it.
right now we’re sitting around 621, so it already broke a big level.
🧠 what that might mean:
- if price gets back above 626, maybe we bounce back toward **629**
- if not, and it keeps chilling under that **50 EMA (around 624)**, it’s probably still weak
nothing confirmed yet, i’m just watching how price moves around those spots.
⚠️ RSi is sketchy too:
rsi is making lower highs, even when price was up; that’s called
bearish divergence
basically means momentum isn’t really behind the move
📉 If it keeps dropping:
if we lose 621, next support might be around **615**
and if that breaks? maybe even **610 gets swept** before any bounce
📝 Just how i’m seeing it rn:
not calling anything, just building my plan out loud
Still learning. open to feedback if you see something different
what levels are you watching?
I want everyone to win. 💛
Отказ от ответственности
Все виды контента, которые вы можете увидеть на TradingView, не являются финансовыми, инвестиционными, торговыми или любыми другими рекомендациями. Мы не предоставляем советы по покупке и продаже активов. Подробнее — в Условиях использования TradingView.
Отказ от ответственности
Все виды контента, которые вы можете увидеть на TradingView, не являются финансовыми, инвестиционными, торговыми или любыми другими рекомендациями. Мы не предоставляем советы по покупке и продаже активов. Подробнее — в Условиях использования TradingView.