Technical Analysis and Key Levels
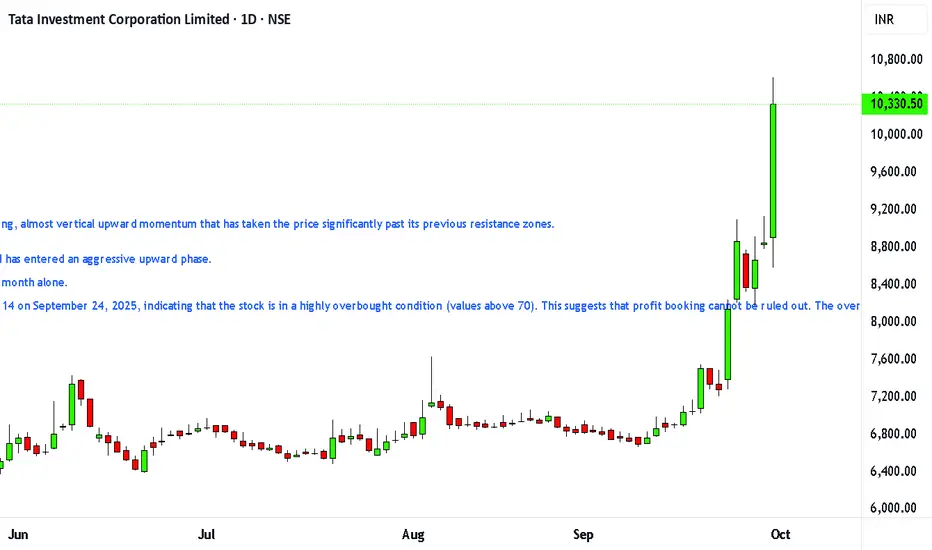
The provided weekly chart (Image 1) and daily chart (Image 2) clearly show a strong, almost vertical upward momentum that has taken the price significantly past its previous resistance zones.
Current Technical Outlook
Trend: The trend is identified as a strong bullish reversal after a sharp decline and has entered an aggressive upward phase.
Price Movement: The stock has seen a massive surge, gaining over 50% in the last month alone.
Technical Indicators: The 14-day Relative Strength Index (RSI) was recorded at 87.14 on September 24, 2025, indicating that the stock is in a highly overbought condition (values above 70). This suggests that profit booking cannot be ruled out. The overall market sentiment, however, remains "very bullish" as of September 30, 2025.
Automated Tools/Indicators/Screeners available at kkonline.org/nimblrta
Отказ от ответственности
Все виды контента, которые вы можете увидеть на TradingView, не являются финансовыми, инвестиционными, торговыми или любыми другими рекомендациями. Мы не предоставляем советы по покупке и продаже активов. Подробнее — в Условиях использования TradingView.