⚡ Tata Power – Bullish Reversal Pattern on Daily Chart
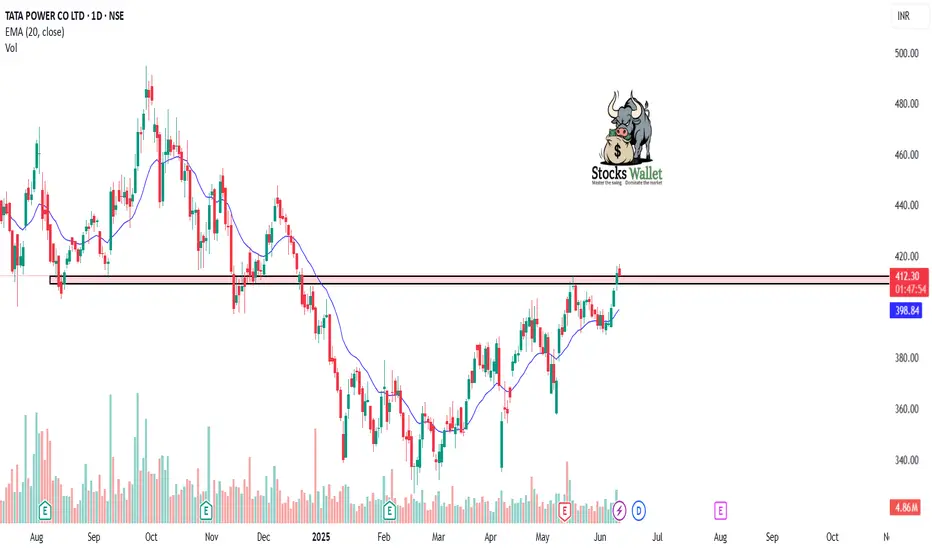
Chart: Tata Power – Daily Timeframe
Tata Power has formed a strong bullish reversal setup after retesting a key support zone near ₹420. The stock has shown strong buying interest with rising volume and a bullish engulfing candle, indicating a potential start of a new upward leg.
🔹 Technical Highlights:
Price bounced from previous swing support (₹420–₹425)
Bullish engulfing candle + volume surge = strong buyer presence
RSI reversing from 50 zone and trending upward
20 EMA acting as dynamic support
📌 Trade Plan:
Entry Zone: ₹430–435
Target 1: ₹450
Target 2: ₹470
Stop Loss: Below ₹420 (closing basis)
The broader trend remains positive, and this could be the beginning of a new up-move. A breakout above ₹440 on strong volume would further confirm the bullish trend continuation.
⚠️ This analysis is for educational purposes only. Please do your own research before trading.
Отказ от ответственности
Информация и публикации не предназначены для предоставления и не являются финансовыми, инвестиционными, торговыми или другими видами советов или рекомендаций, предоставленных или одобренных TradingView. Подробнее читайте в Условиях использования.
Отказ от ответственности
Информация и публикации не предназначены для предоставления и не являются финансовыми, инвестиционными, торговыми или другими видами советов или рекомендаций, предоставленных или одобренных TradingView. Подробнее читайте в Условиях использования.