✅ Current Technical Picture
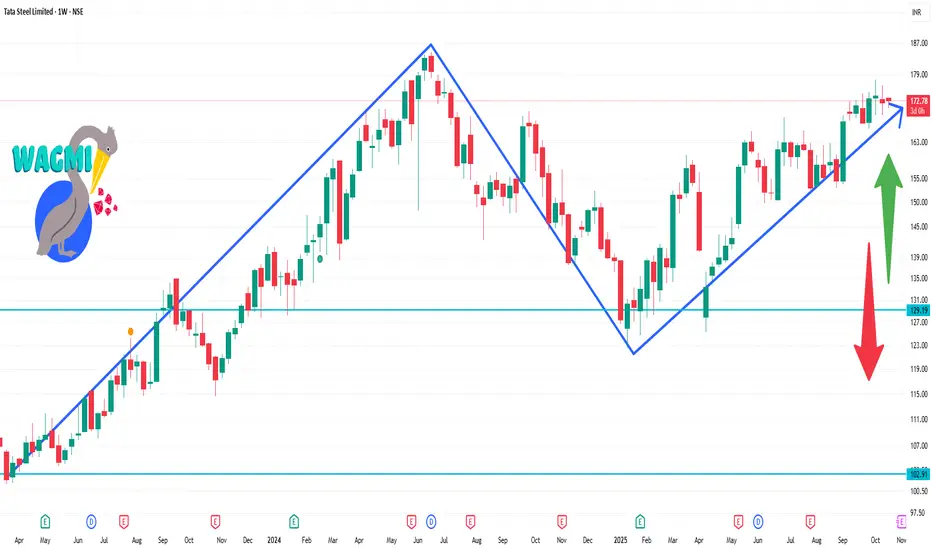
The stock is trading around ₹172.
On the weekly time-frame, one source flags a “Strong Buy”.
On the short term (1-week/moving averages/oscillators), other sources show caution:
One platform shows the 1-week summary as “Bearish” (moving averages & oscillators) for the week-frame.
Support levels are mentioned around ₹167-169 and further around ~₹157 in case of deeper pull-back.
Resistance or recent highs near the ~₹173-175 zone.
🎯 Key Levels to Watch (1-week horizon)
Support:
First support around ~ ₹167-169. (If price dips)
A deeper support/accumulated volume zone near ~ ₹157-160 if weakness extends.
Resistance / Ceiling:
Near term resistance ~ ₹172-175. Price recently around that level.
If bullish momentum builds, breakout above ~₹175 could open further upside (but stronger risk).
Похожие публикации
Отказ от ответственности
Все виды контента, которые вы можете увидеть на TradingView, не являются финансовыми, инвестиционными, торговыми или любыми другими рекомендациями. Мы не предоставляем советы по покупке и продаже активов. Подробнее — в Условиях использования TradingView.
Похожие публикации
Отказ от ответственности
Все виды контента, которые вы можете увидеть на TradingView, не являются финансовыми, инвестиционными, торговыми или любыми другими рекомендациями. Мы не предоставляем советы по покупке и продаже активов. Подробнее — в Условиях использования TradingView.