📊 Current Price Context (as of mid‑January 2026)
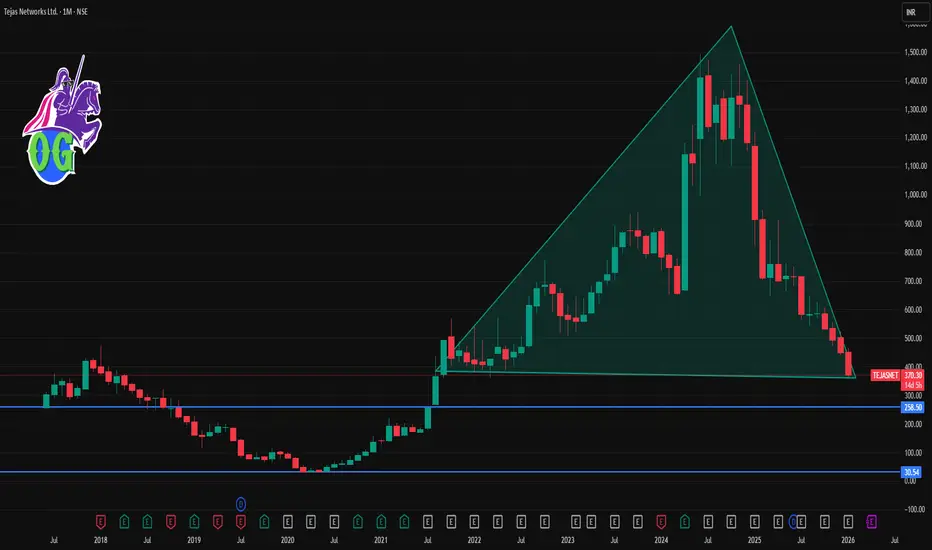
Tejas Networks is trading around ₹370‑₹375 on NSE/BSE.
The stock recently hit a 52‑week low near ₹364 after weak quarterly earnings and sales decline.
📉 Short‑Term Technical Levels (1‑Month View)
🔻 Immediate Support Zones
These are levels where the stock could find buyers or stall further declines:
₹366‑₹370 — current short‑term support (intraday pivot & recent low).
₹362‑₹366 — lower pivot/secondary intraday support.
~₹356‑₹362 — deeper support if momentum remains weak.
📈 Resistance Levels (Upside Hurdles)
For any bounce or recovery attempt:
₹377‑₹380 — near current pivot/resistance range.
~₹390‑₹395 — next resistance zone (prior price congestion).
₹405‑₹410+ — stronger resistance (short‑term target for recovery).
🧠 Trading/Price Action Tips (1‑month)
Bullish Scenario (countertrend bounce):
A break above ₹380‑₹390 with good volume could shift short‑term sentiment and target ₹405‑₹410+.
Bearish/Continued downtrend:
If support at ₹366‑₹370 breaks convincingly, the next zone near ₹362 then ₹356–₹360 becomes focus.
Похожие публикации
Отказ от ответственности
Информация и публикации не предназначены для предоставления и не являются финансовыми, инвестиционными, торговыми или другими видами советов или рекомендаций, предоставленных или одобренных TradingView. Подробнее читайте в Условиях использования.
Похожие публикации
Отказ от ответственности
Информация и публикации не предназначены для предоставления и не являются финансовыми, инвестиционными, торговыми или другими видами советов или рекомендаций, предоставленных или одобренных TradingView. Подробнее читайте в Условиях использования.