Market Analysis: CONFIRMING The Bull Run Continues
Market Analysis: CONFIRMING The Bull Run Continues!!
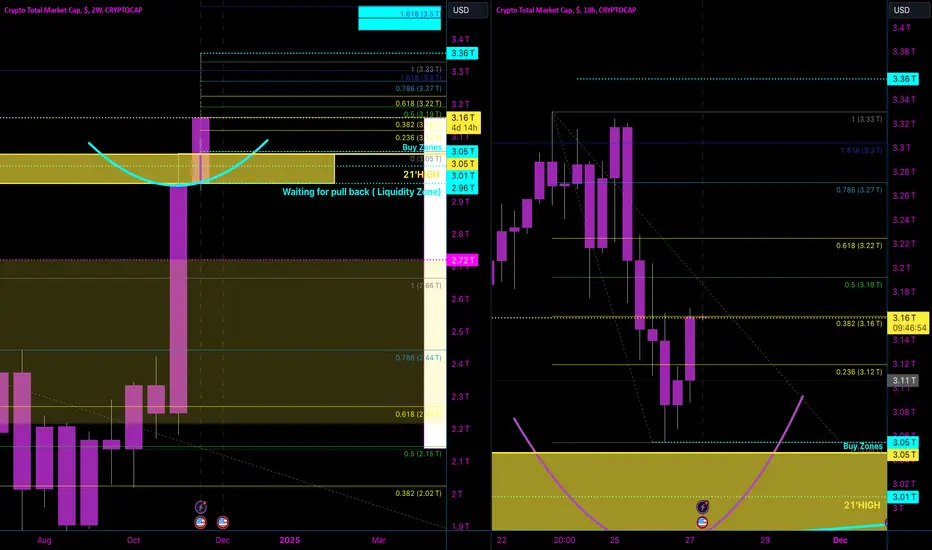
After thorough analysis, I’ve been reviewing the lower timeframes and identified a W formation (double bottom) on the 4-hour chart, which has been confirmed by a deeper look into the 10-hour chart. This consistency across timeframes strongly indicates that structure is solid and the bottom for the current candle has been established.
What This Means:
• Re-Test of 3.36 Trillion: Based on current market behavior, I firmly believe we are gearing up for a re-test of 3.36 trillion in the total crypto market cap. This is a critical level, and breaking above it would likely lead to a new higher high.
• Bullish Confirmation: Both the W formation on lower timeframes and the liquidity zones identified on higher timeframes (like the 2-week chart) signify a healthy bullish structure. This suggests the bull run is far from over.
Key Observations:
1. Lower Timeframe Insights:
• Switching to the 4-hour chart revealed the W formation, signaling a double bottom and potential reversal.
• The 10-hour chart confirmed this structure, showing that the pullback has been retested and validated.
2. Higher Timeframe Confirmation:
• The 2-week chart highlights the importance of liquidity zones where support builds.
• Price consistently pulls back into these zones to gather momentum before pushing higher.
3. Line Chart Comparison:
• Using a line chart, I demonstrated the difference between an M pattern (triple top) and a W pattern (double bottom).
• The W pattern aligns with the current bullish momentum, while the M pattern signals a bearish pullback.
My Prediction:
Today, November 27 2024 , I confidently predict that we are entering the next phase of this bull run. The crypto market cap will:
1. Re-test 3.36 trillion, either today, tomorrow, or later this week.
2. Push past that level, forming a new higher high and continuing the bullish trend.
Why This Matters:
• Healthy Candle Structure: Each candle, especially on higher timeframes, is being built with layers of support, ensuring stability for the next bullish move.
• Bullish Sentiment: The pullbacks we’re seeing are part of a natural cycle to build momentum for the next leg up.
• Get Ready: With the structure in place and confirmation across timeframes, the market is setting up for significant moves. It’s about to get crazy.
Final Note:
This analysis highlights the importance of using multi-timeframe analysis to understand market structure. By focusing on higher timeframes for clarity and lower timeframes for precision, you can better anticipate market movements and trade with confidence. The bull run isn’t over—stay prepared for what’s to come.
Похожие публикации
Отказ от ответственности
Все виды контента, которые вы можете увидеть на TradingView, не являются финансовыми, инвестиционными, торговыми или любыми другими рекомендациями. Мы не предоставляем советы по покупке и продаже активов. Подробнее — в Условиях использования TradingView.
Отказ от ответственности
Все виды контента, которые вы можете увидеть на TradingView, не являются финансовыми, инвестиционными, торговыми или любыми другими рекомендациями. Мы не предоставляем советы по покупке и продаже активов. Подробнее — в Условиях использования TradingView.